 2
2peptides
spectra
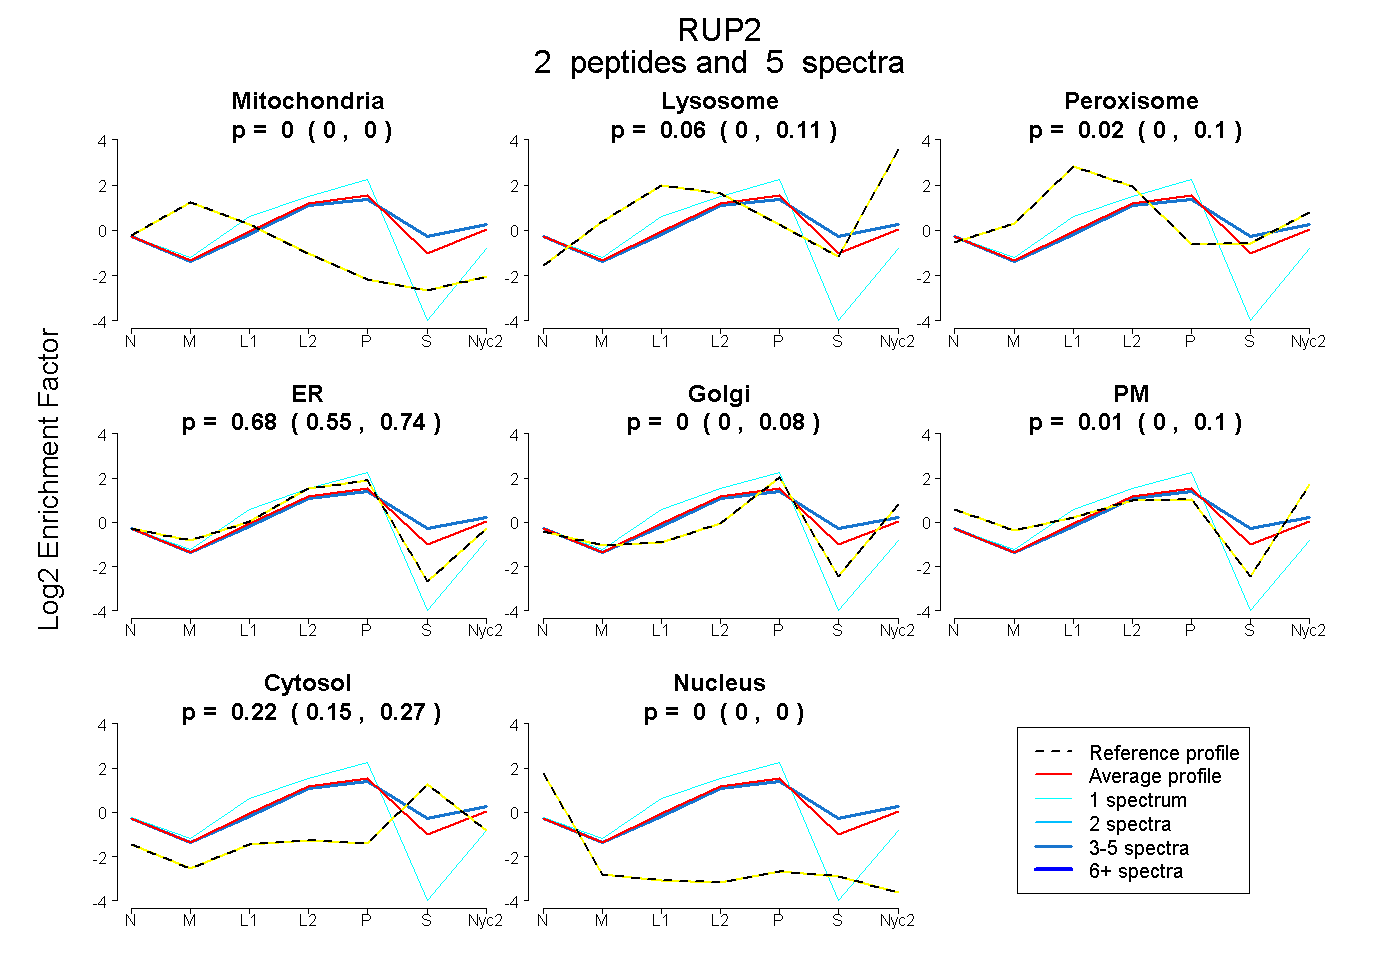
0.000 | 0.000
0.000 | 0.108
0.000 | 0.101
0.550 | 0.744
0.000 | 0.084
0.000 | 0.104
0.148 | 0.268
0.000 | 0.000
1peptide
spectrum
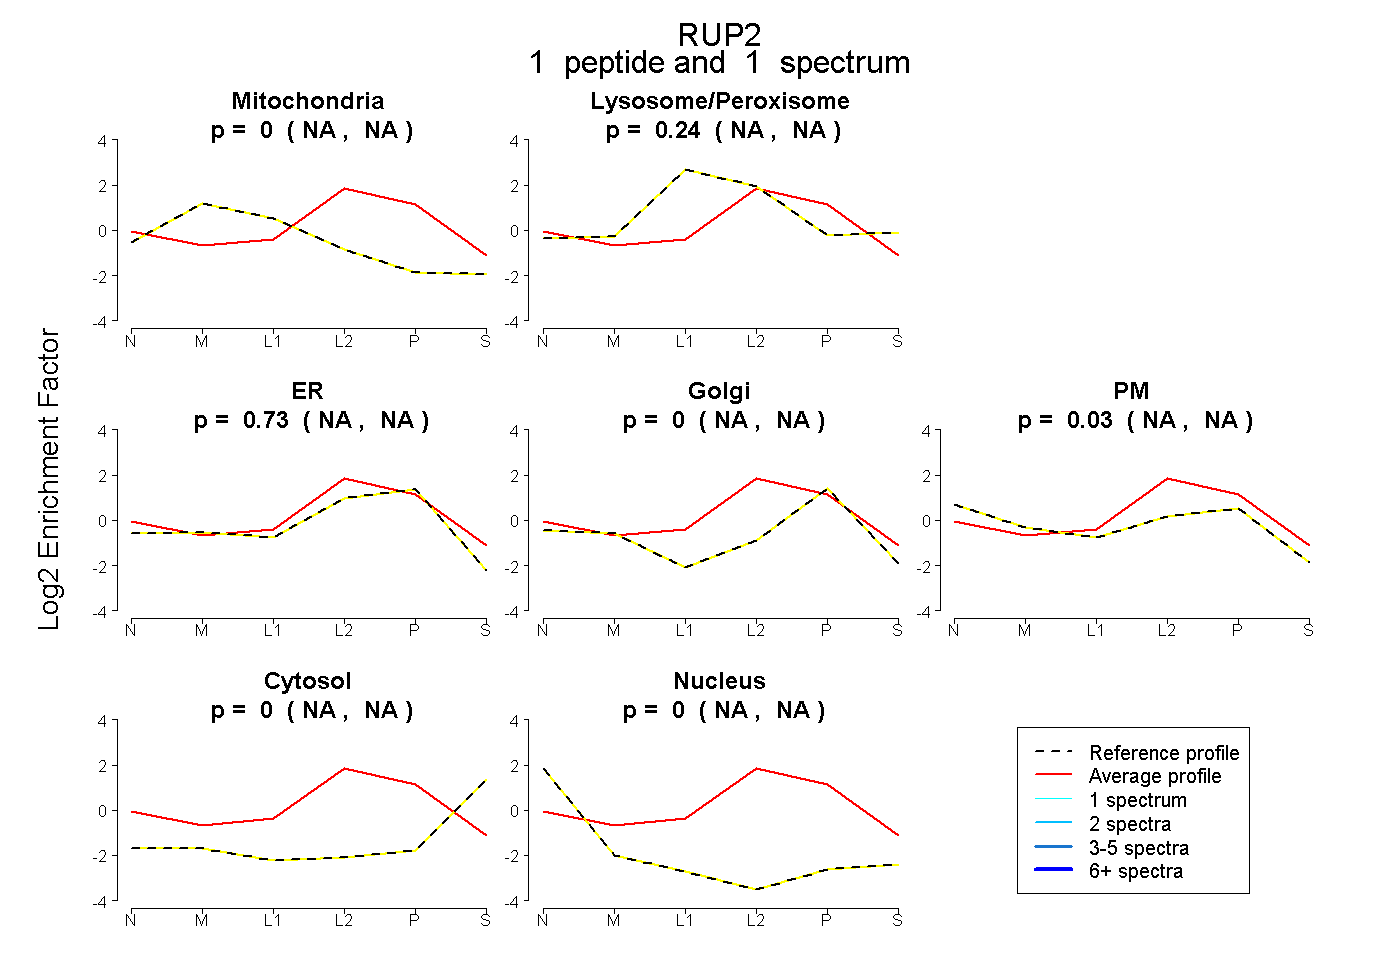
NA | NA
NA | NA
NA | NA
NA | NA
NA | NA
NA | NA
NA | NA
1peptide
spectra
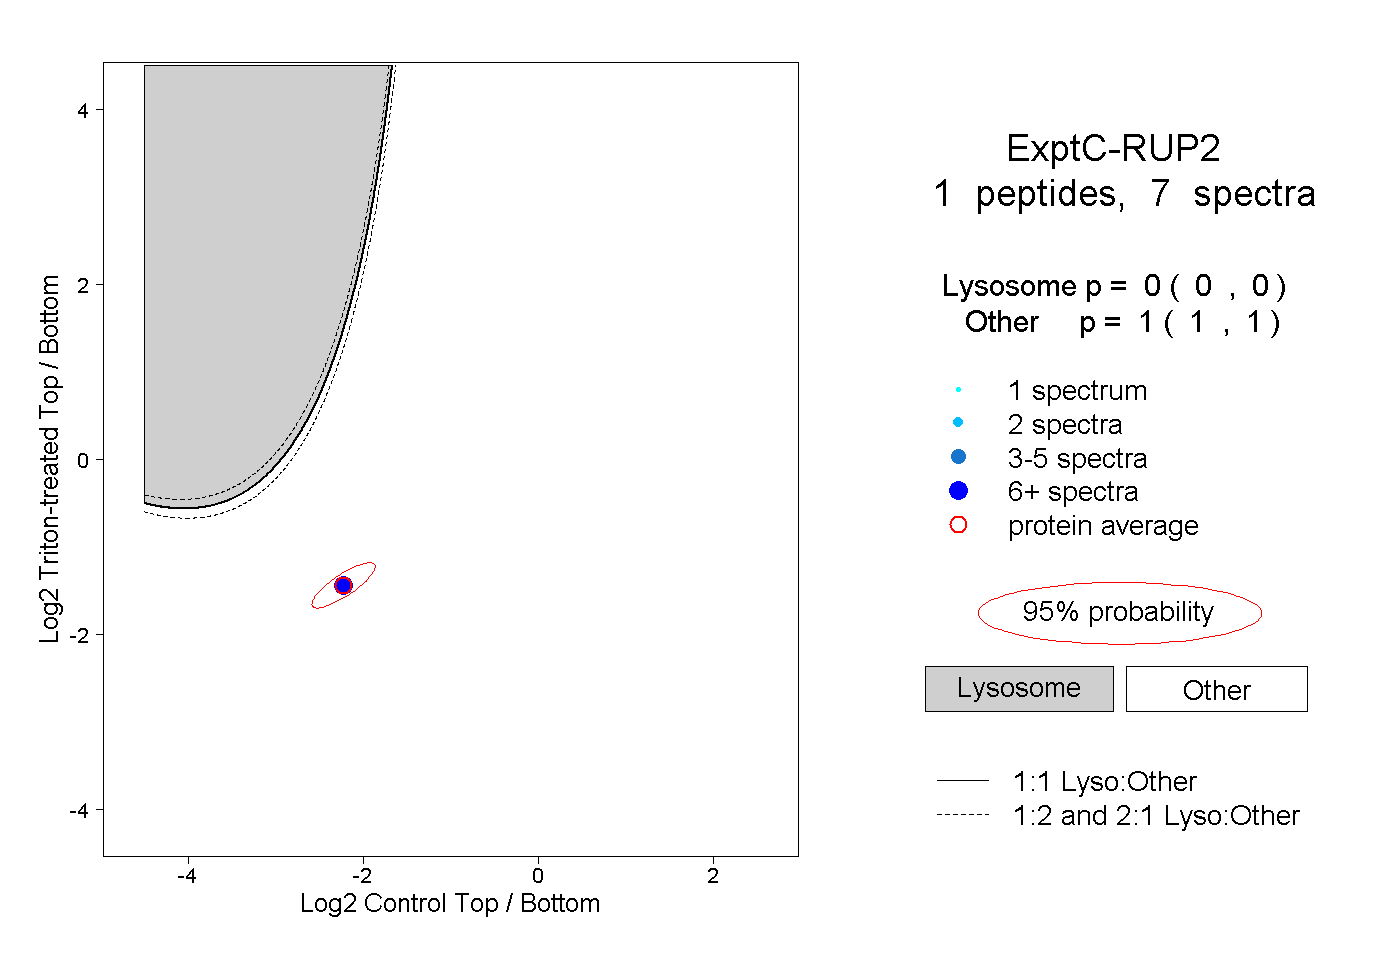
0.000 | 0.000
1.000 | 1.000
1peptide
spectrum
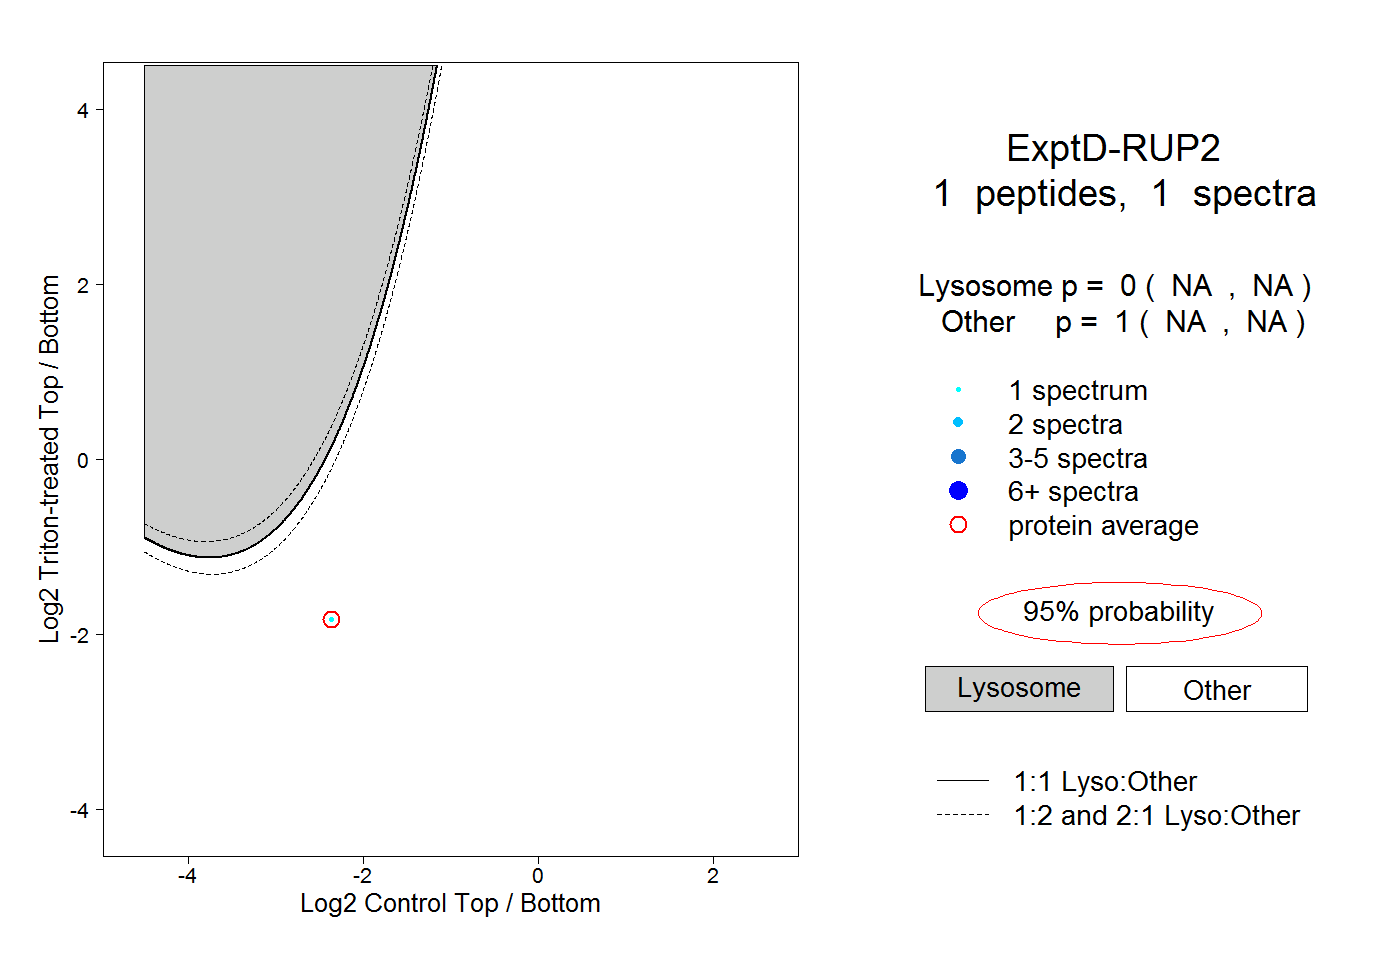
NA | NA
NA | NA