 3
3peptides
spectra
0.000 | 0.000
0.000 | 0.084
0.196 | 0.350
0.000 | 0.136
0.378 | 0.593
0.000 | 0.063
0.062 | 0.123
0.000 | 0.000
2peptides
spectra
0.000 | 0.000
1.000 | 1.000
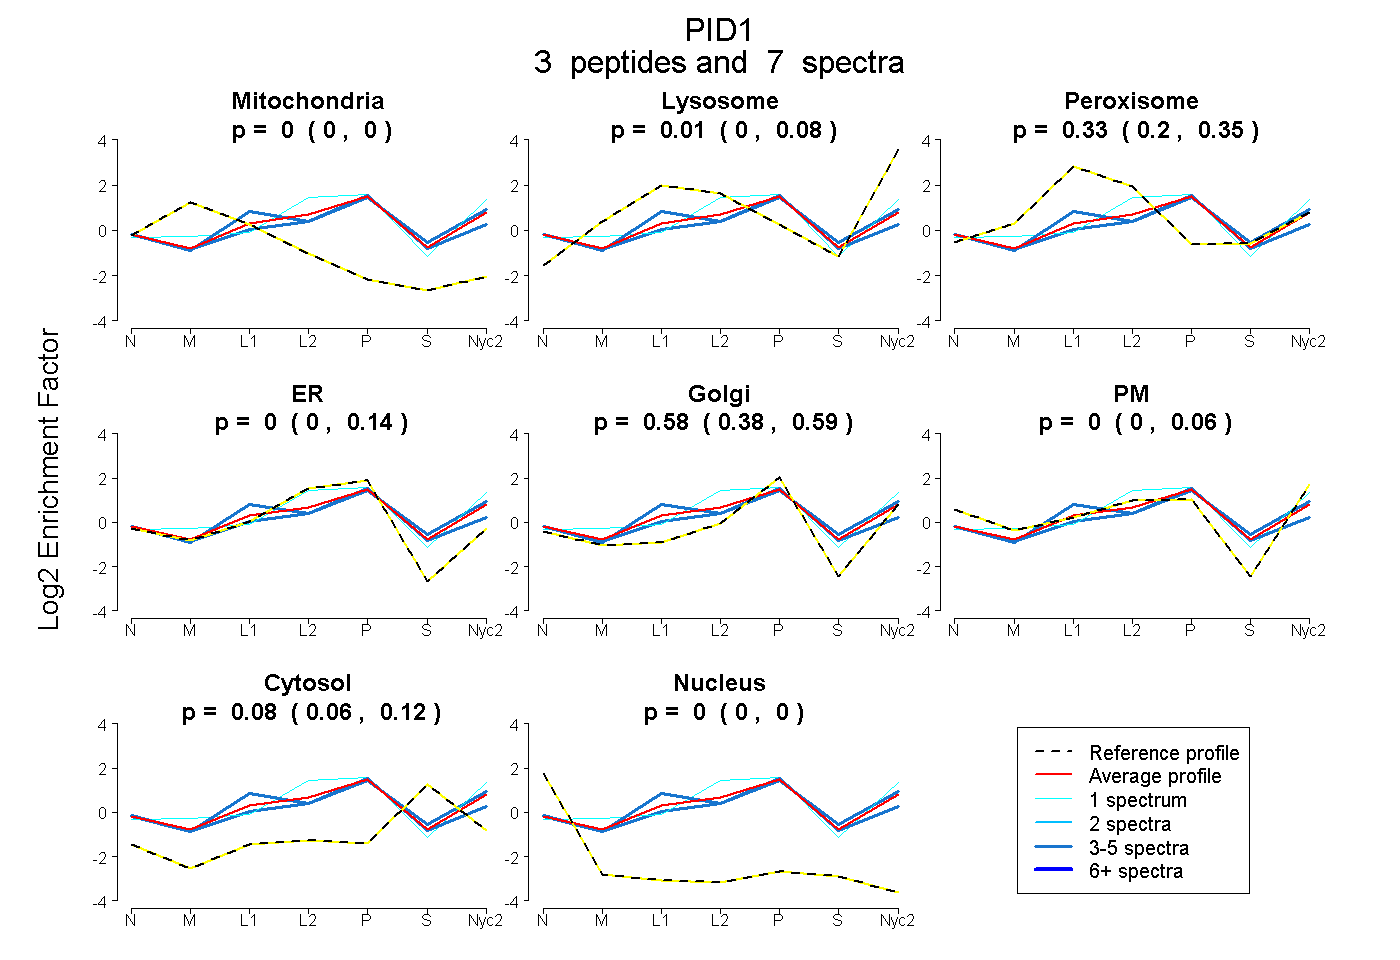
| Plot | Mito | Lyso | Perox | ER | Golgi | PM | Cytosol | Nucleus | |||||
| Expt A |
3 peptides |
7 spectra |
|
0.000 0.000 | 0.000 |
0.008 0.000 | 0.084 |
0.326 0.196 | 0.350 |
0.000 0.000 | 0.136 |
0.583 0.378 | 0.593 |
0.000 0.000 | 0.063 |
0.082 0.062 | 0.123 |
0.000 0.000 | 0.000 |
||
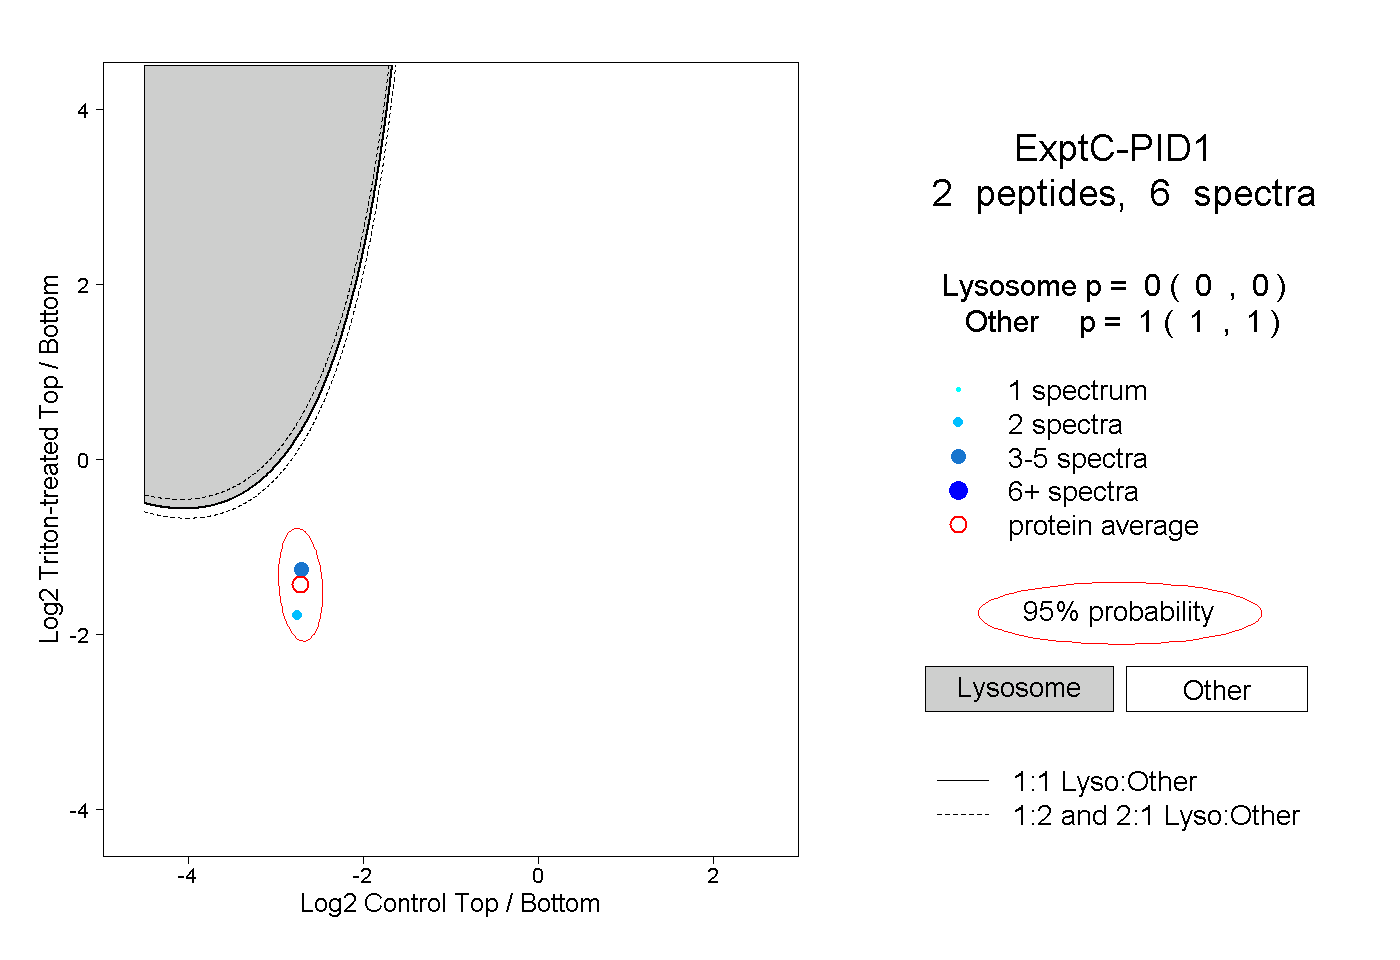
| Plot | Lyso | Other | |||||||||||
| Expt C |
2 peptides |
6 spectra |
|
0.000 0.000 | 0.000 |
1.000 1.000 | 1.000 |