 3
3peptides
spectra
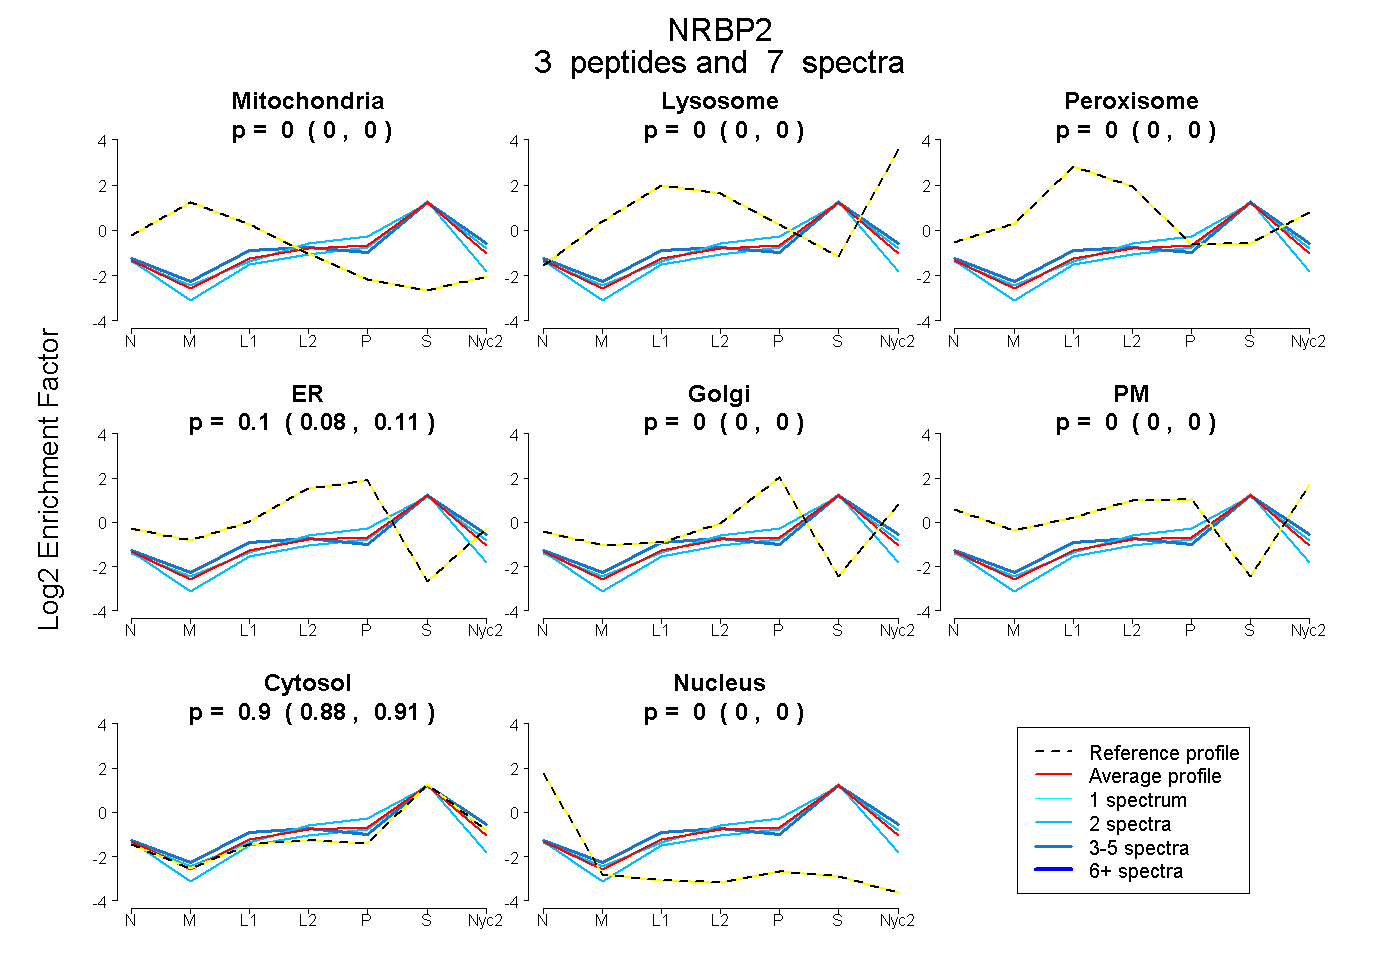
0.000 | 0.000
0.000 | 0.000
0.000 | 0.000
0.081 | 0.115
0.000 | 0.000
0.000 | 0.000
0.882 | 0.914
0.000 | 0.000
| Plot | Mito | Lyso | Perox | ER | Golgi | PM | Cytosol | Nucleus | |||||
| Expt A |
3 peptides |
7 spectra |
|
0.000 0.000 | 0.000 |
0.000 0.000 | 0.000 |
0.000 0.000 | 0.000 |
0.100 0.081 | 0.115 |
0.000 0.000 | 0.000 |
0.000 0.000 | 0.000 |
0.900 0.882 | 0.914 |
0.000 0.000 | 0.000 |
| 2 spectra, VTEEAIAR | 0.000 | 0.000 | 0.000 | 0.154 | 0.000 | 0.000 | 0.846 | 0.000 | ||
| 3 spectra, VLFEVHSLK | 0.000 | 0.016 | 0.101 | 0.020 | 0.000 | 0.000 | 0.863 | 0.000 | ||
| 2 spectra, EFILSCLAR | 0.000 | 0.000 | 0.000 | 0.020 | 0.000 | 0.000 | 0.935 | 0.045 |
| Plot | Mito | Lyso or Perox | ER | Golgi | PM | Cytosol | Nucleus | ||||||
| Expt B |
1 peptide |
1 spectrum |
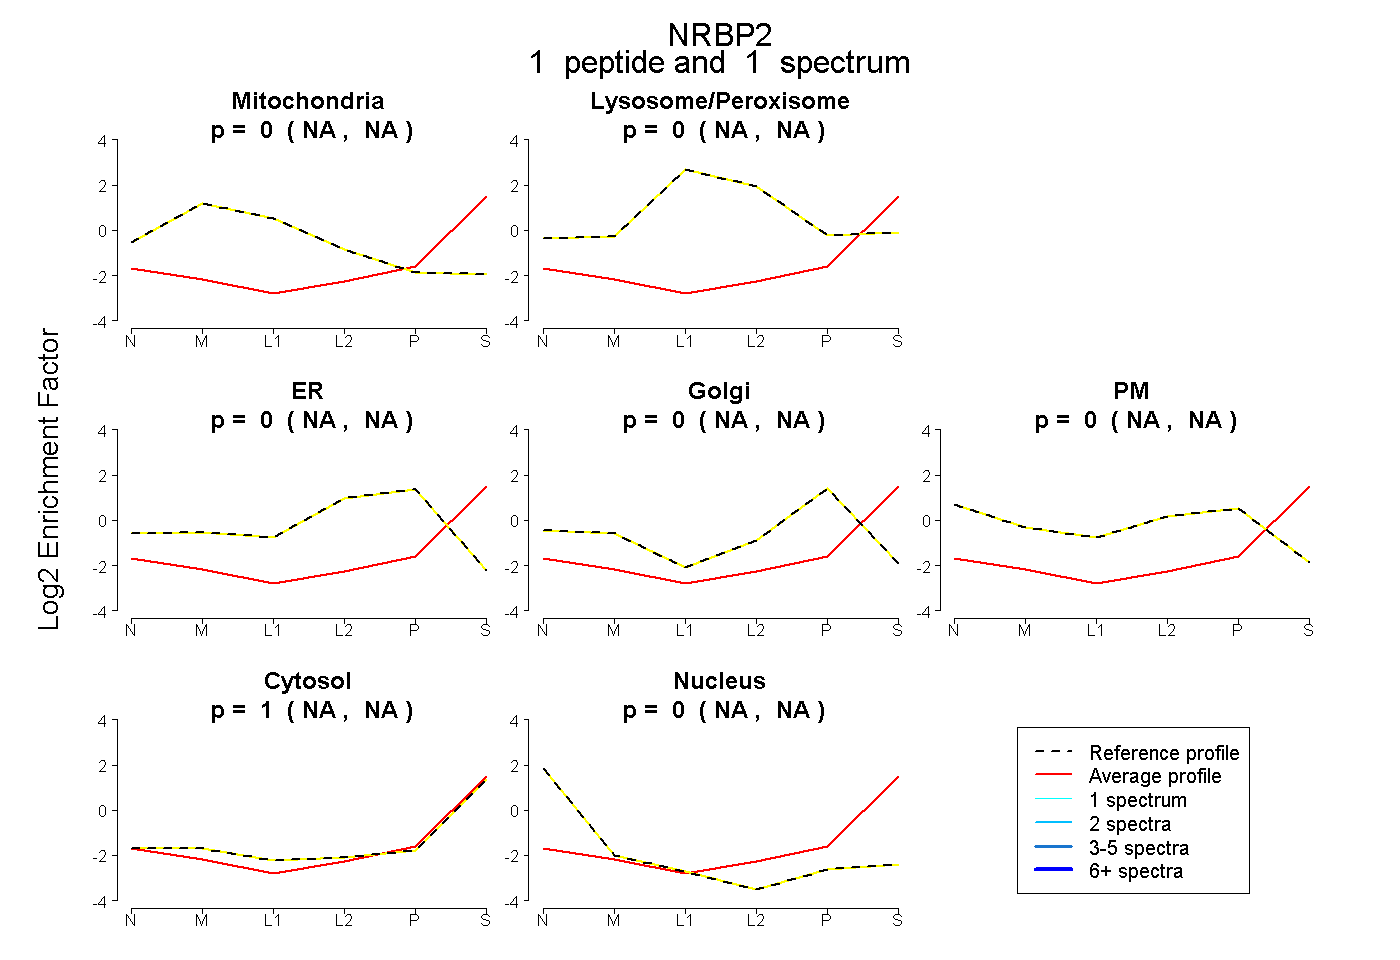 |
0.000 NA | NA |
0.000 NA | NA |
0.000 NA | NA |
0.000 NA | NA |
0.000 NA | NA |
0.997 NA | NA |
0.003 NA | NA |
|||
| Plot | Lyso | Other | |||||||||||
| Expt C |
3 peptides |
6 spectra |
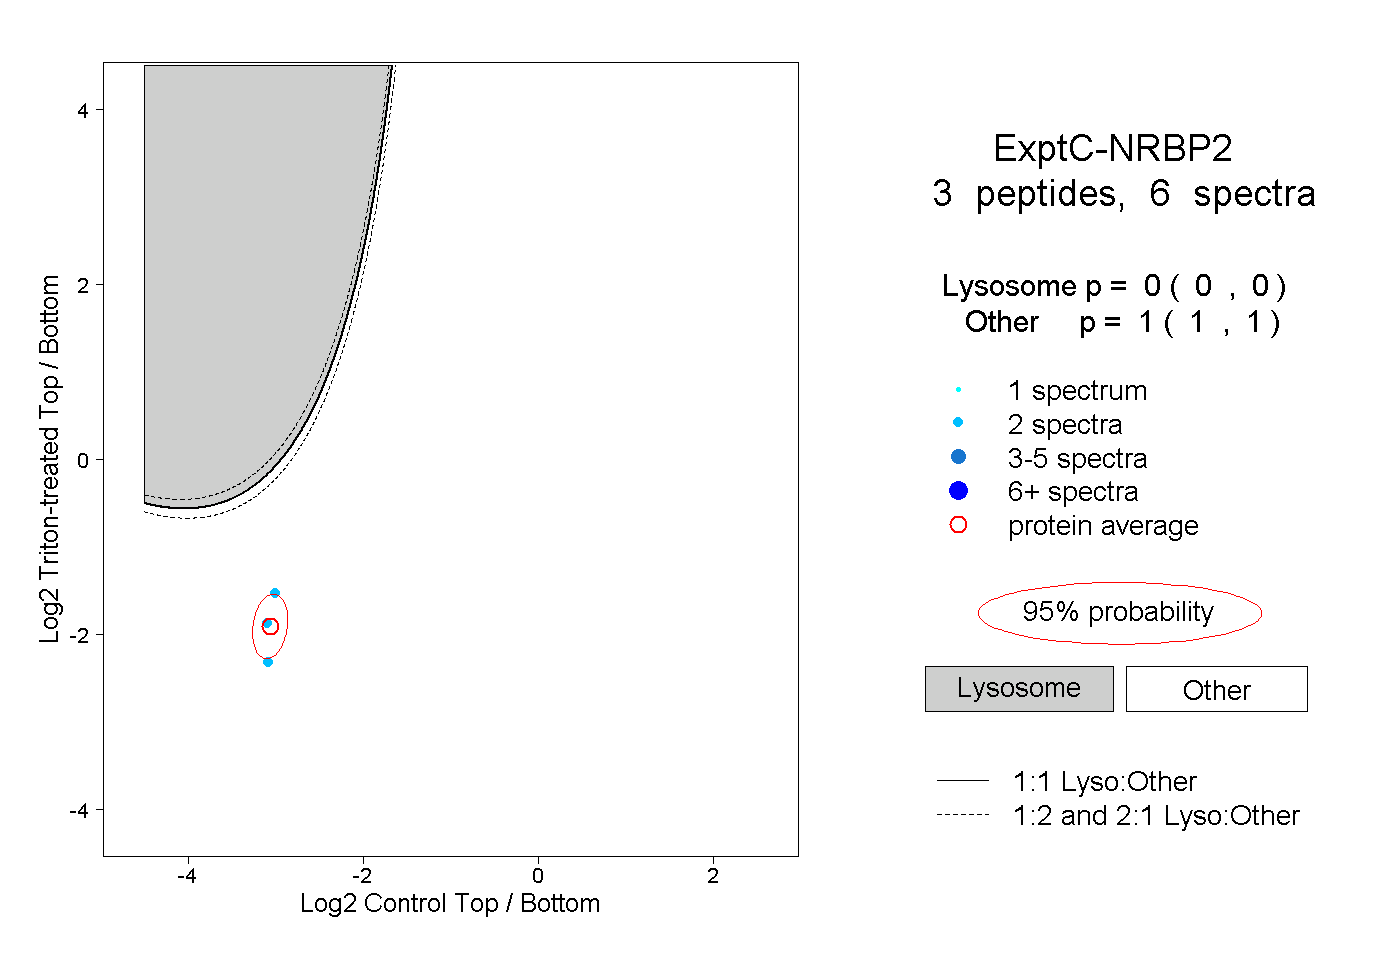 |
0.000 0.000 | 0.000 |
1.000 1.000 | 1.000 |