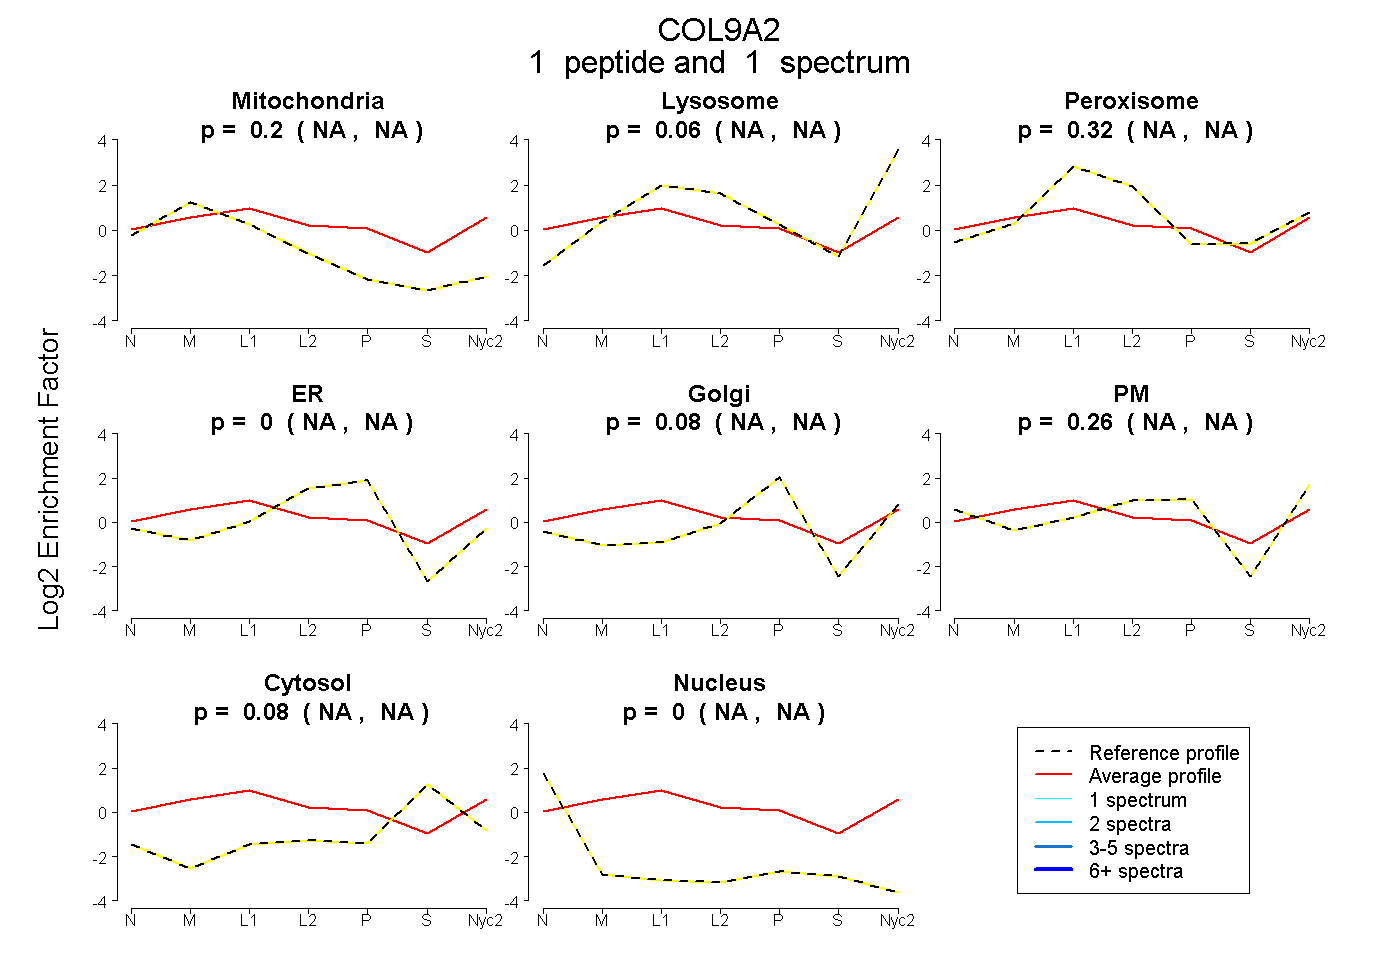
 1
1peptide
spectrum
NA | NA
NA | NA
NA | NA
NA | NA
NA | NA
NA | NA
NA | NA
NA | NA
| Plot | Mito | Lyso | Perox | ER | Golgi | PM | Cytosol | Nucleus | |||||
| Expt A |
1 peptide |
1 spectrum |
|
0.202 NA | NA |
0.065 NA | NA |
0.317 NA | NA |
0.000 NA | NA |
0.082 NA | NA |
0.257 NA | NA |
0.077 NA | NA |
0.000 NA | NA |
| 1 spectrum, DGTPGIPGMK | 0.202 | 0.065 | 0.317 | 0.000 | 0.082 | 0.257 | 0.077 | 0.000 |
| Plot | Lyso | Other | |||||||||||
| Expt C |
1 peptide |
2 spectra |
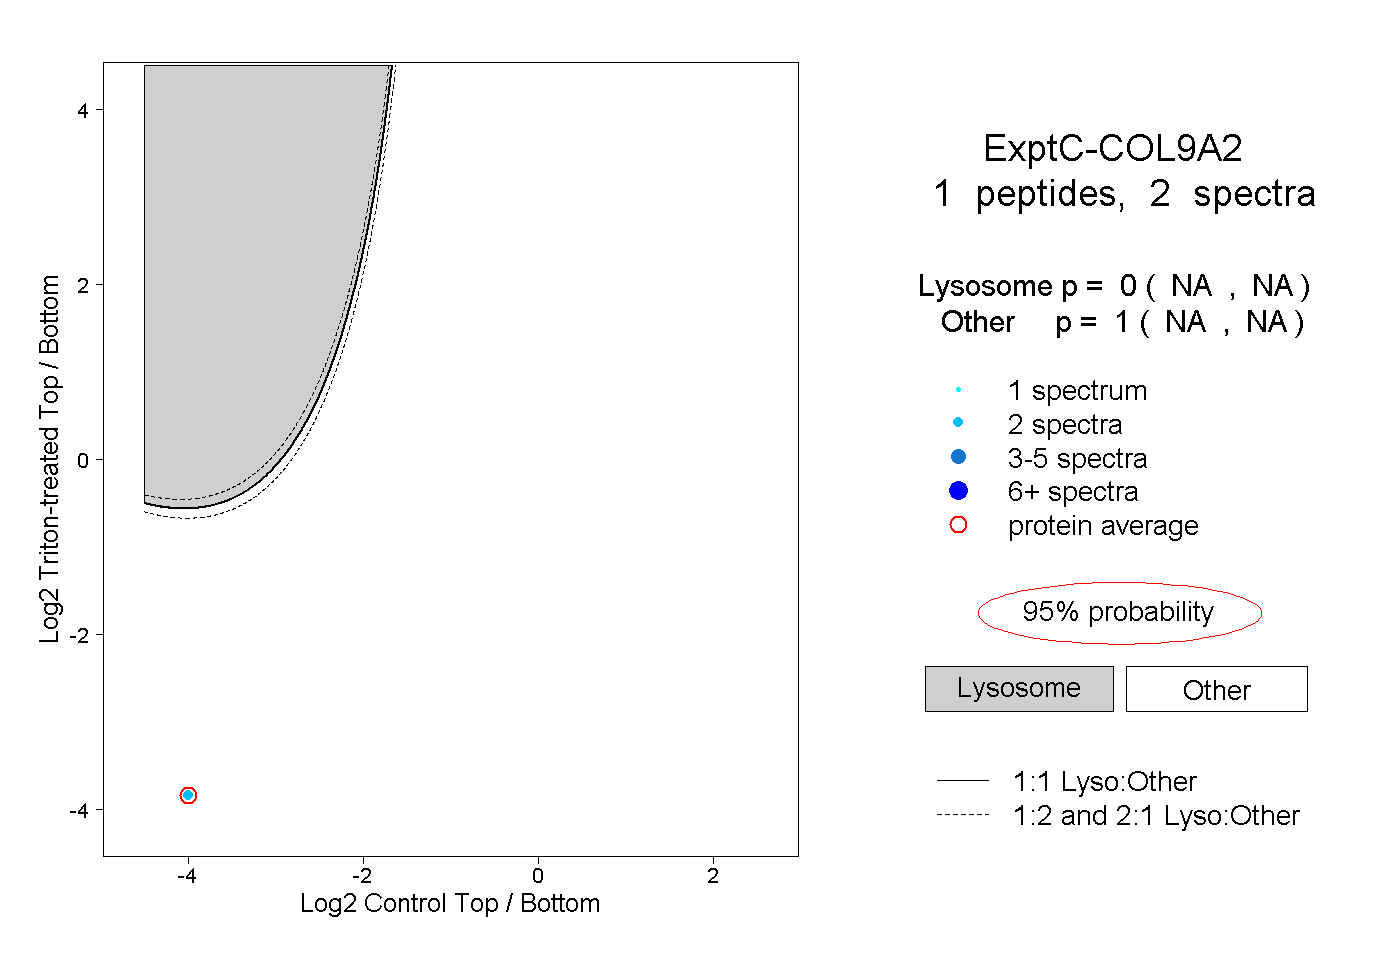 |
0.000 NA | NA |
1.000 NA | NA |