 10
10peptides
spectra
0.000 | 0.000
0.000 | 0.000
0.000 | 0.000
0.000 | 0.000
0.000 | 0.000
0.000 | 0.000
1.000 | 1.000
0.000 | 0.000
| Plot | Mito | Lyso | Perox | ER | Golgi | PM | Cytosol | Nucleus | |||||
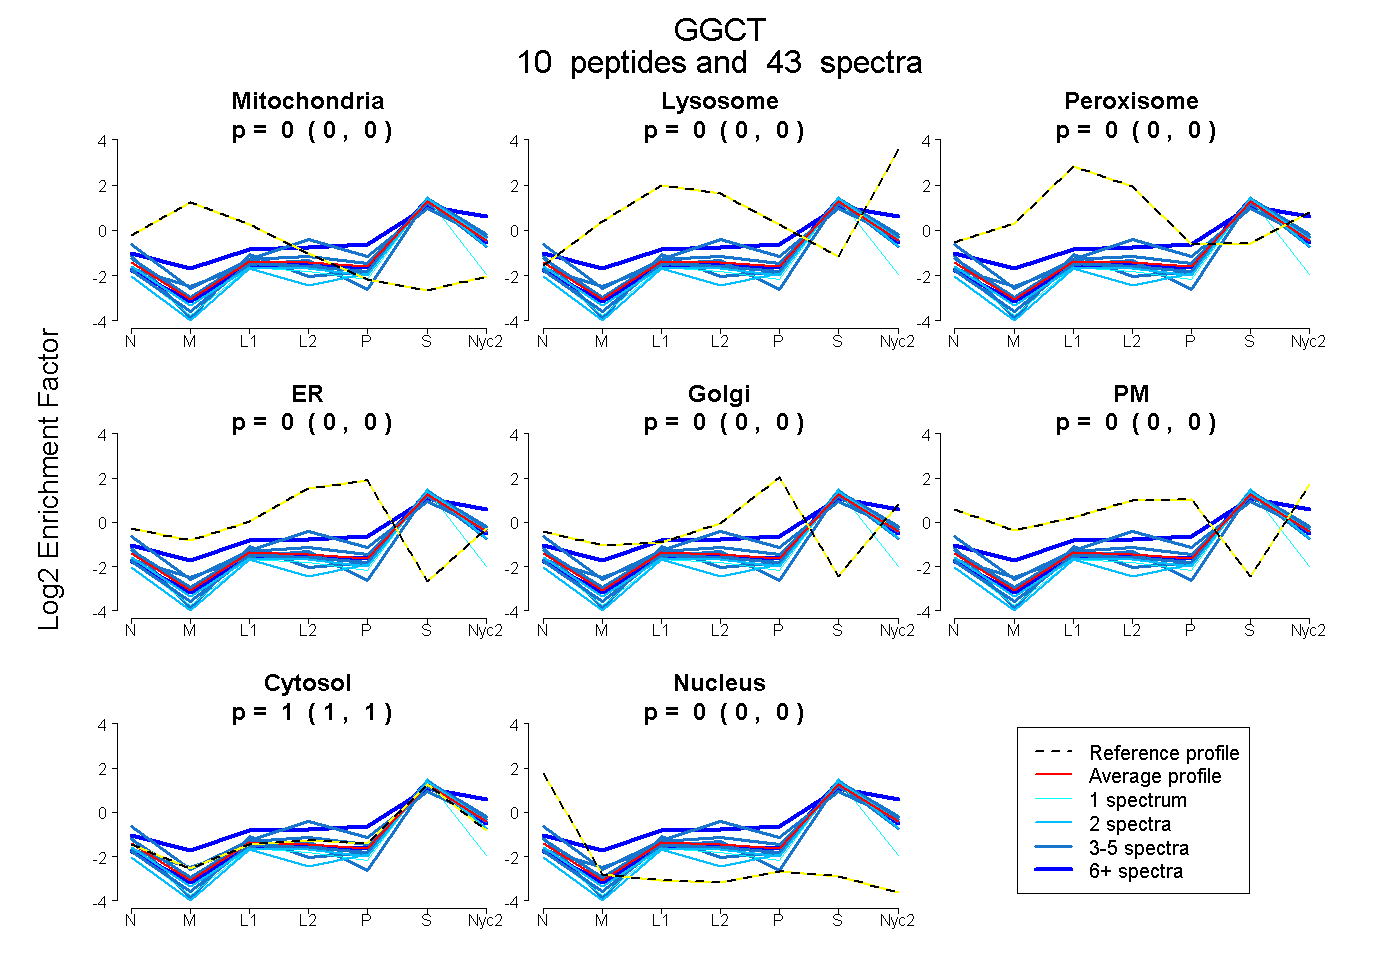
| Expt A |
10 peptides |
43 spectra |
|
0.000 0.000 | 0.000 |
0.000 0.000 | 0.000 |
0.000 0.000 | 0.000 |
0.000 0.000 | 0.000 |
0.000 0.000 | 0.000 |
0.000 0.000 | 0.000 |
1.000 1.000 | 1.000 |
0.000 0.000 | 0.000 |
| 1 spectrum, NPSAVFCCVAR | 0.000 | 0.000 | 0.000 | 0.000 | 0.000 | 0.000 | 0.903 | 0.097 | ||
| 5 spectra, APPSPQYK | 0.000 | 0.000 | 0.000 | 0.000 | 0.000 | 0.000 | 0.952 | 0.048 | ||
| 12 spectra, ISDEMEDIIK | 0.000 | 0.000 | 0.000 | 0.000 | 0.000 | 0.000 | 1.000 | 0.000 | ||
| 3 spectra, LNVIEPNDYK | 0.000 | 0.000 | 0.000 | 0.000 | 0.000 | 0.000 | 1.000 | 0.000 | ||
| 2 spectra, VTTQQGK | 0.000 | 0.000 | 0.000 | 0.000 | 0.000 | 0.000 | 1.000 | 0.000 | ||
| 4 spectra, LDFGNFQGK | 0.000 | 0.022 | 0.000 | 0.000 | 0.000 | 0.004 | 0.975 | 0.000 | ||
| 2 spectra, SYLMTNYER | 0.000 | 0.000 | 0.000 | 0.000 | 0.000 | 0.000 | 0.988 | 0.012 | ||
| 3 spectra, VICMGAK | 0.000 | 0.000 | 0.000 | 0.000 | 0.000 | 0.000 | 1.000 | 0.000 | ||
| 7 spectra, ENGLPLEYQEK | 0.000 | 0.216 | 0.000 | 0.000 | 0.000 | 0.041 | 0.743 | 0.000 | ||
| 4 spectra, SNLSSLDEQEGVK | 0.000 | 0.000 | 0.007 | 0.000 | 0.000 | 0.152 | 0.841 | 0.000 |
| Plot | Mito | Lyso or Perox | ER | Golgi | PM | Cytosol | Nucleus | ||||||
| Expt B |
4 peptides |
6 spectra |
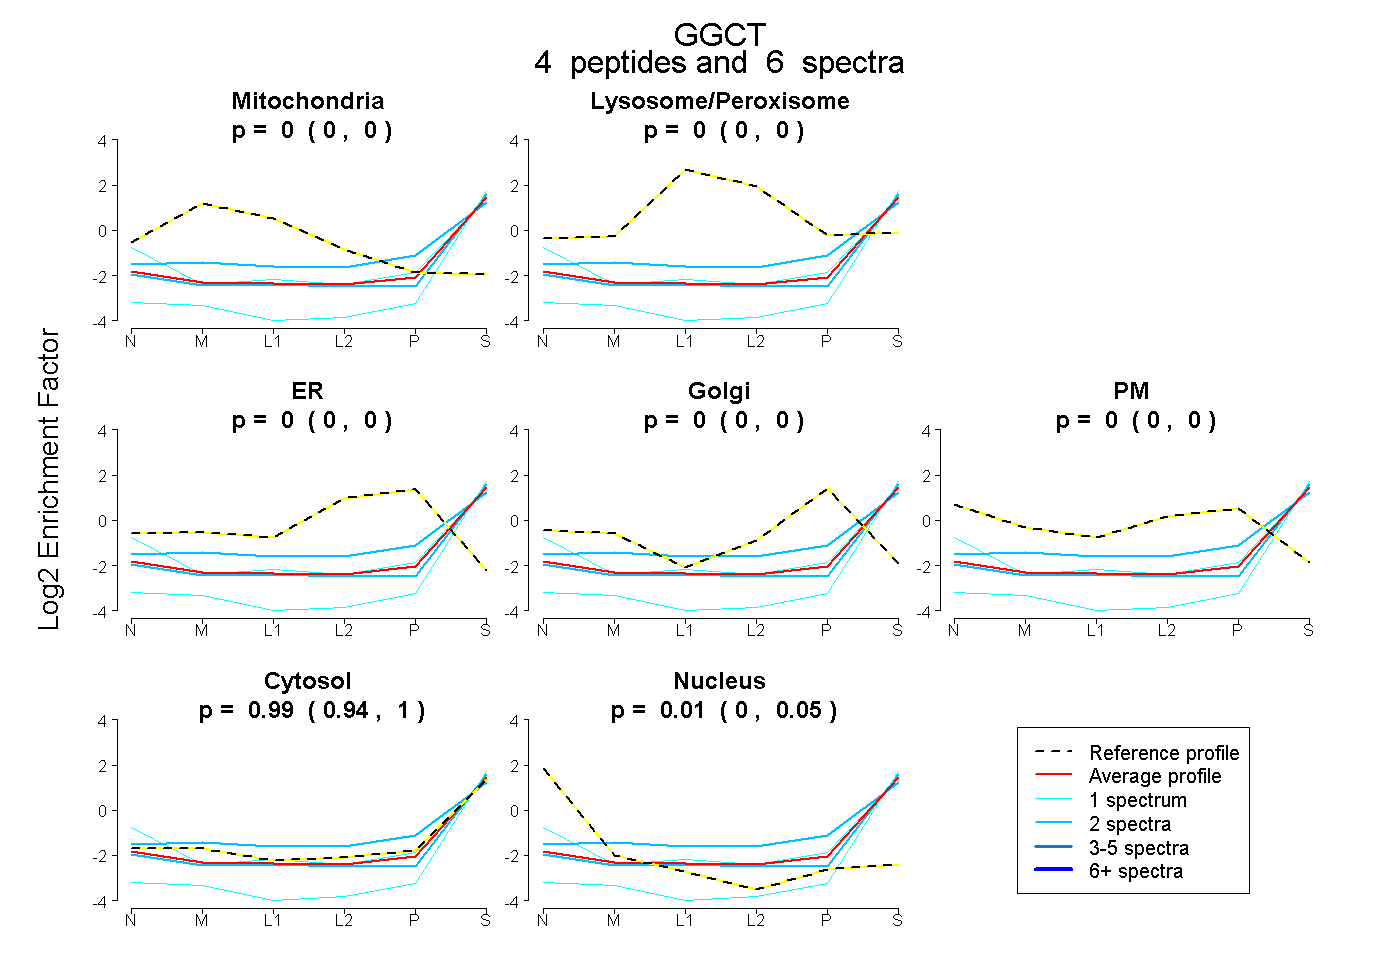 |
0.000 0.000 | 0.000 |
0.000 0.000 | 0.000 |
0.000 0.000 | 0.000 |
0.000 0.000 | 0.000 |
0.000 0.000 | 0.000 |
0.991 0.944 | 1.000 |
0.009 0.000 | 0.048 |
|||
| Plot | Lyso | Other | |||||||||||
| Expt C |
8 peptides |
38 spectra |
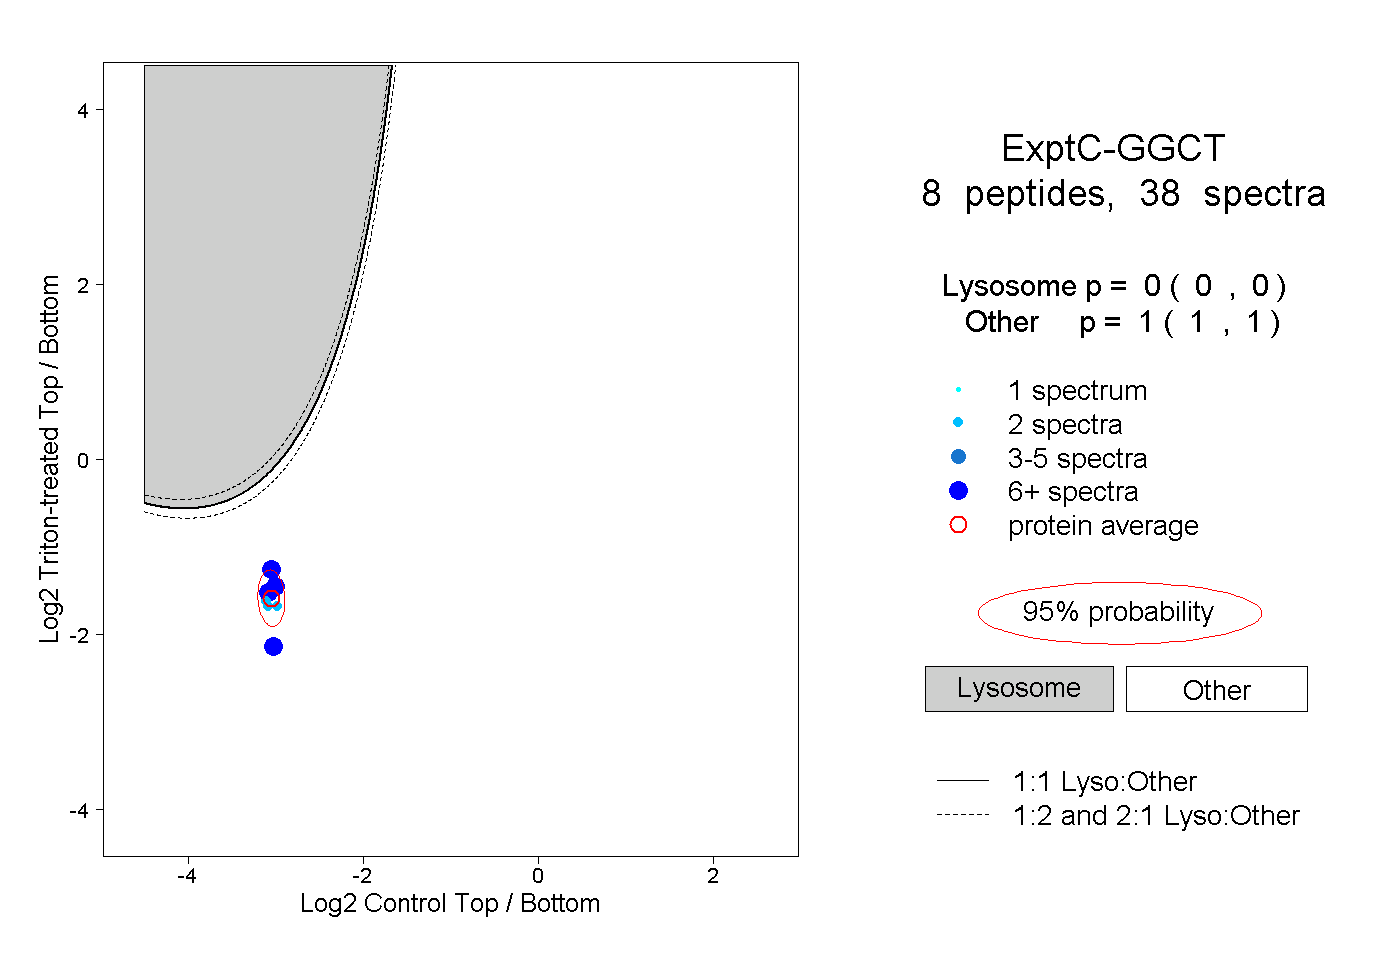 |
0.000 0.000 | 0.000 |
1.000 1.000 | 1.000 |
||||||||
| Plot | Lyso | Other | |||||||||||
| Expt D |
1 peptide |
1 spectrum |
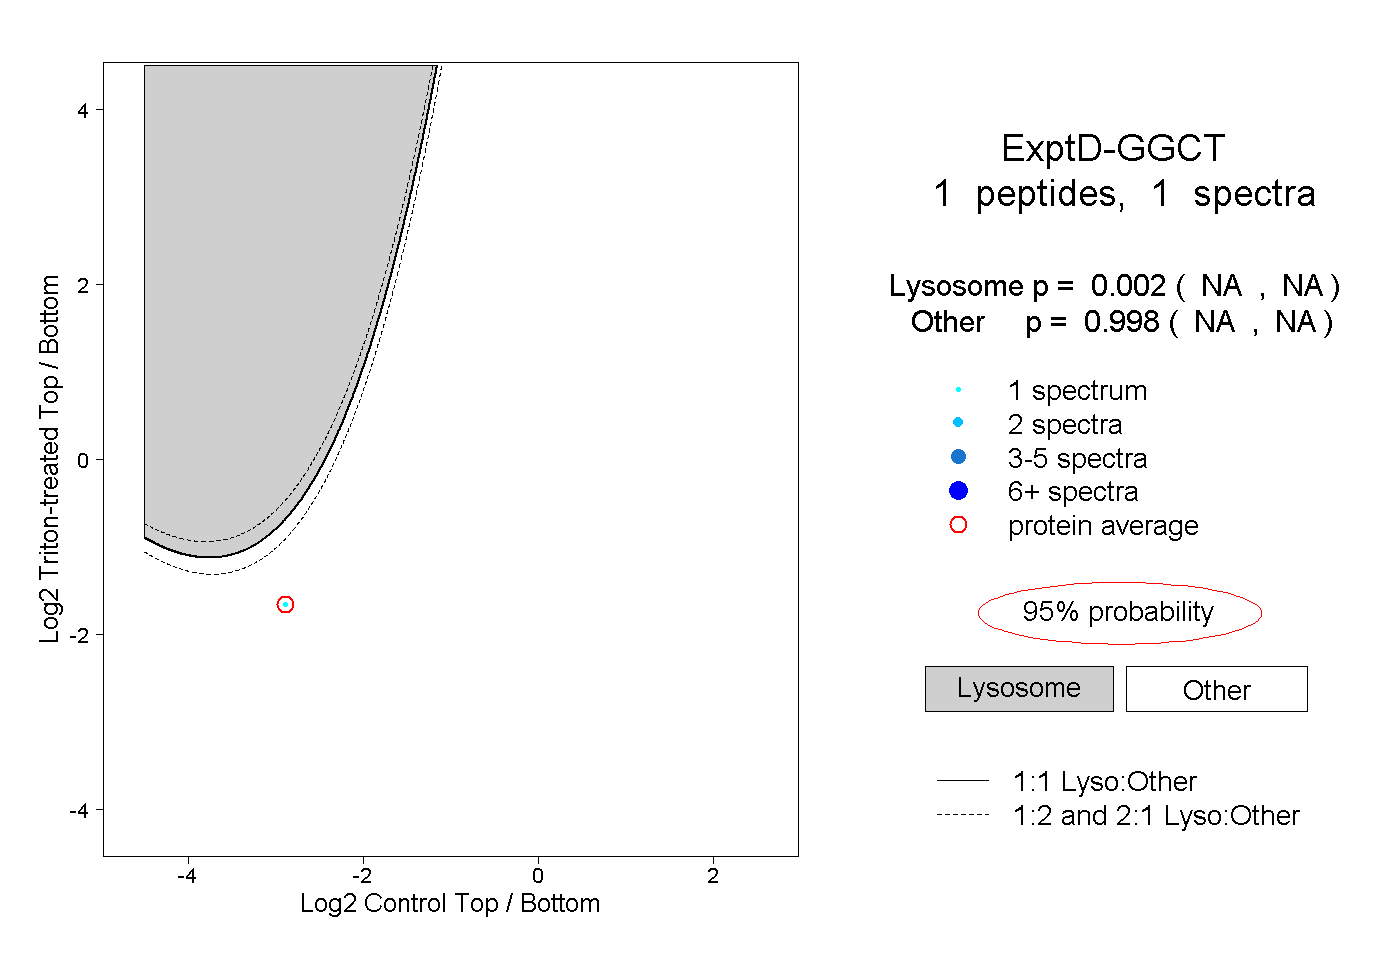 |
0.002 NA | NA |
0.998 NA | NA |