 3
3peptides
spectra
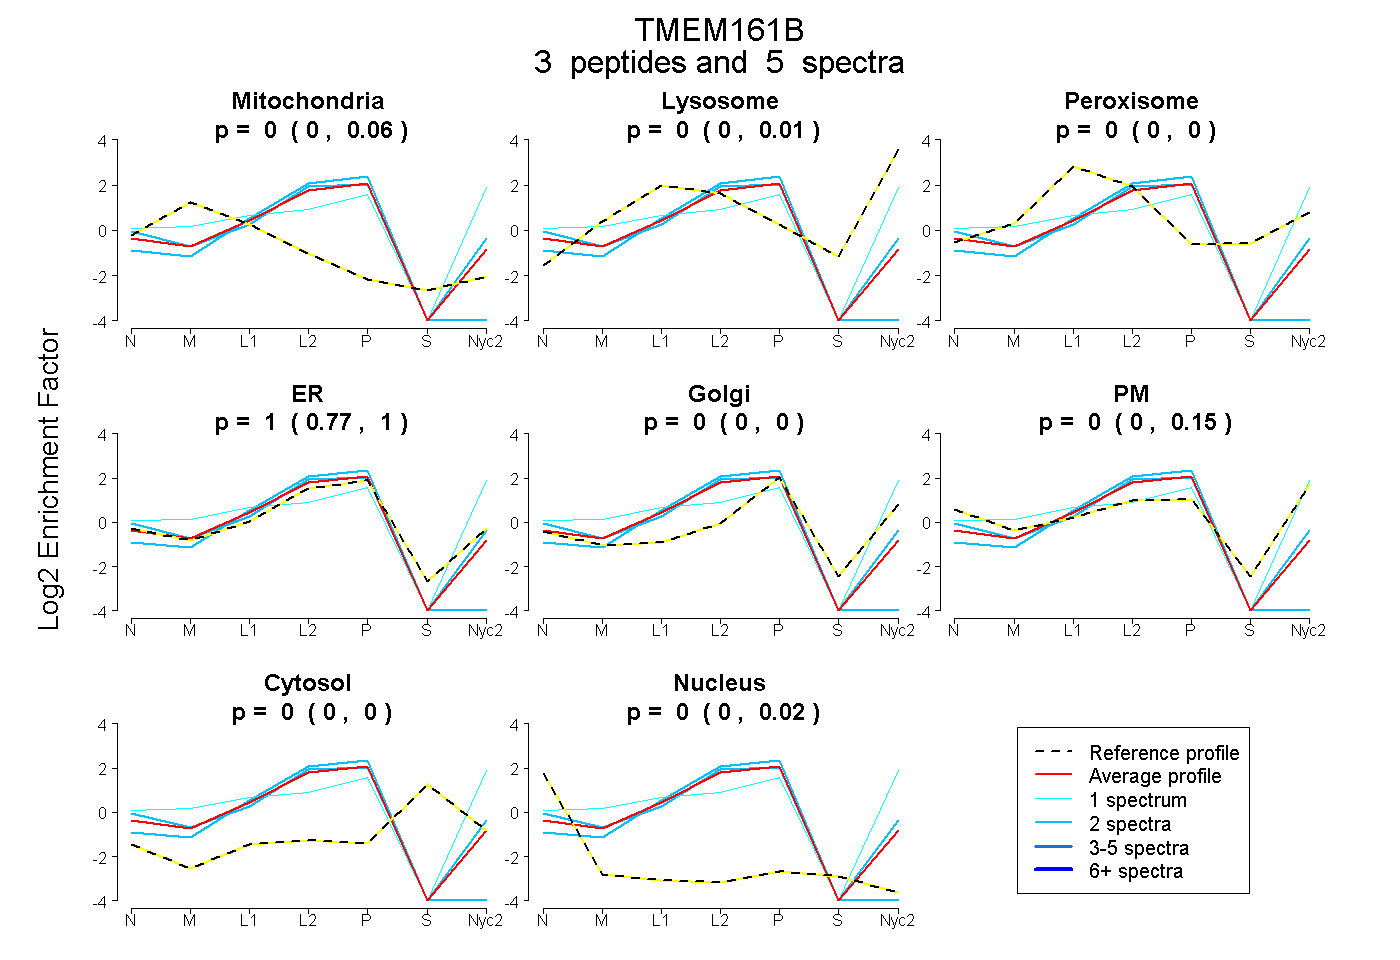
0.000 | 0.062
0.000 | 0.008
0.000 | 0.000
0.769 | 1.000
0.000 | 0.000
0.000 | 0.151
0.000 | 0.000
0.000 | 0.021
2peptides
spectra
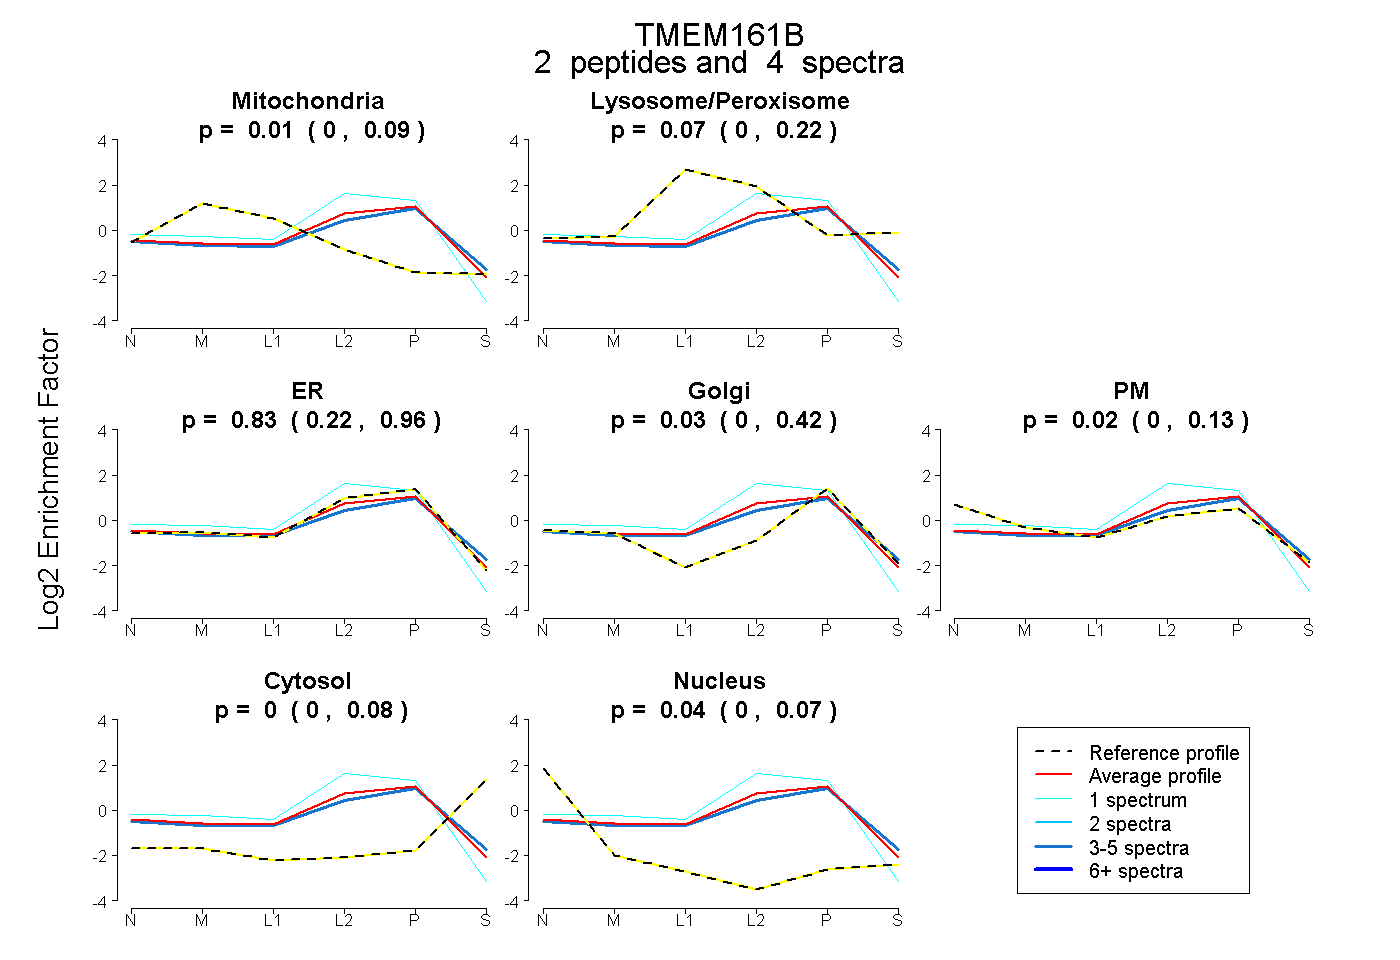
0.000 | 0.087
0.000 | 0.224
0.218 | 0.957
0.000 | 0.415
0.000 | 0.125
0.000 | 0.076
0.000 | 0.071
2peptides
spectra
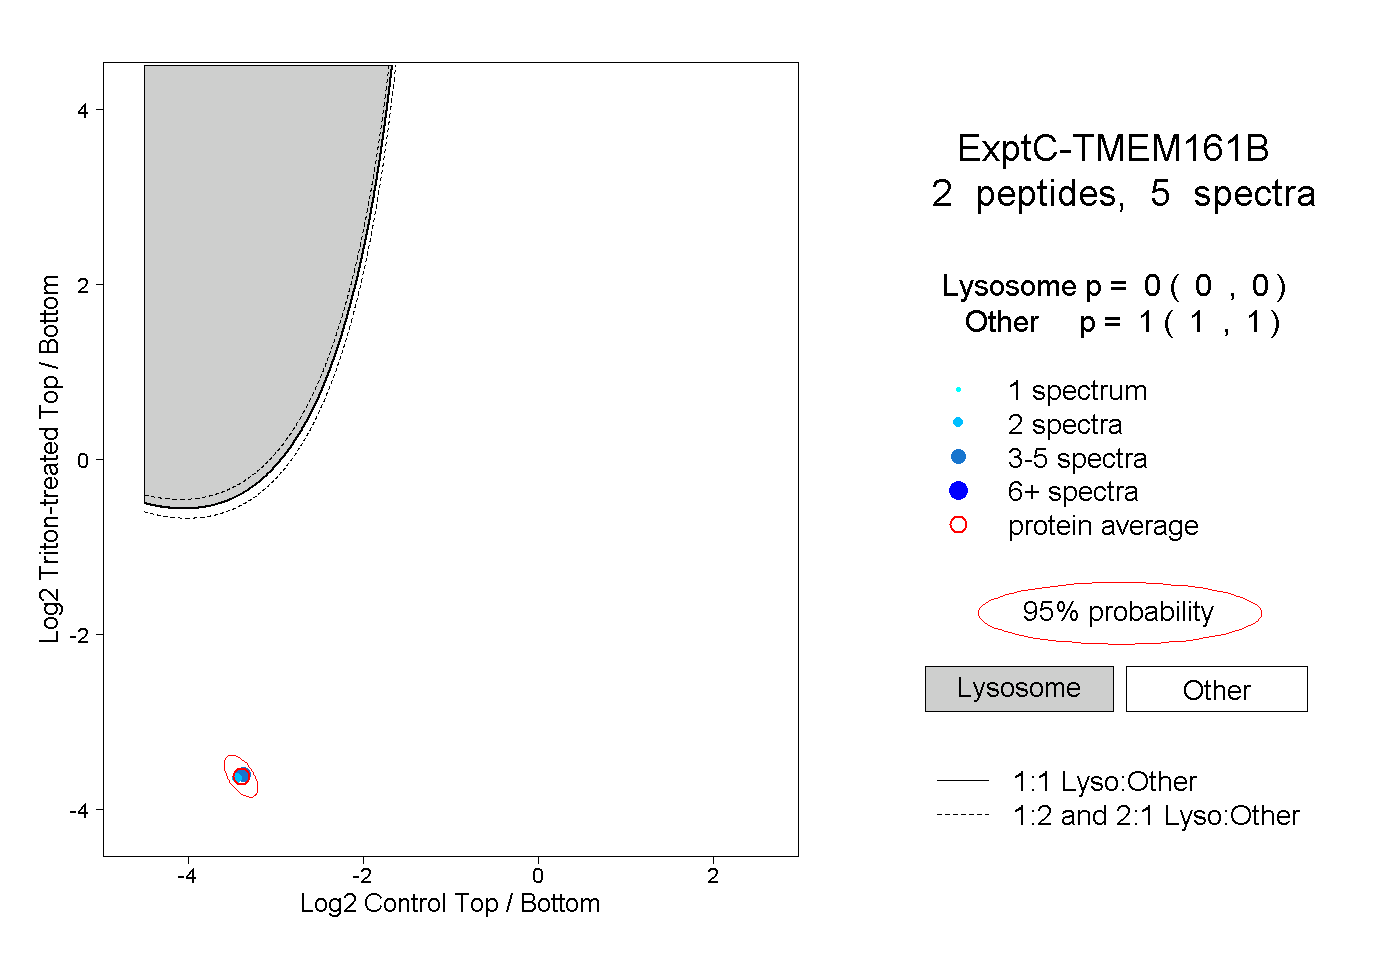
0.000 | 0.000
1.000 | 1.000