 2
2peptides
spectra
0.000 | 0.000
0.000 | 0.000
0.000 | 0.000
0.000 | 0.000
0.072 | 0.231
0.000 | 0.000
0.000 | 0.164
0.679 | 0.844
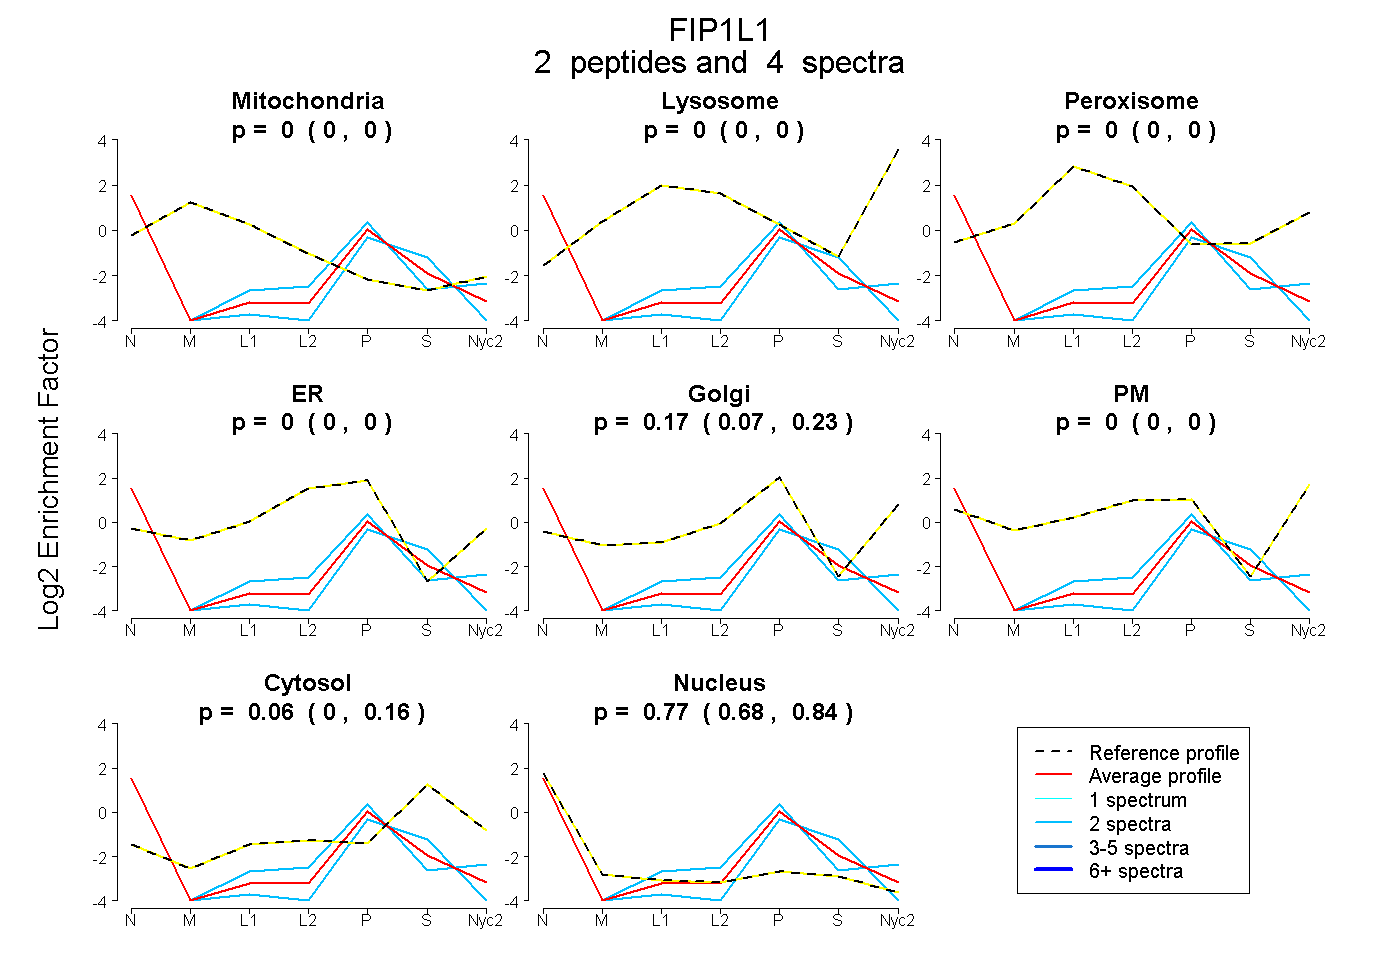
| Plot | Mito | Lyso | Perox | ER | Golgi | PM | Cytosol | Nucleus | |||||
| Expt A |
2 peptides |
4 spectra |
|
0.000 0.000 | 0.000 |
0.000 0.000 | 0.000 |
0.000 0.000 | 0.000 |
0.000 0.000 | 0.000 |
0.169 0.072 | 0.231 |
0.000 0.000 | 0.000 |
0.057 0.000 | 0.164 |
0.774 0.679 | 0.844 |