 2
2peptides
spectra
0.000 | 0.000
0.000 | 0.000
0.000 | 0.000
0.152 | 0.291
0.000 | 0.014
0.124 | 0.270
0.408 | 0.418
0.136 | 0.163
| Plot | Mito | Lyso | Perox | ER | Golgi | PM | Cytosol | Nucleus | |||||
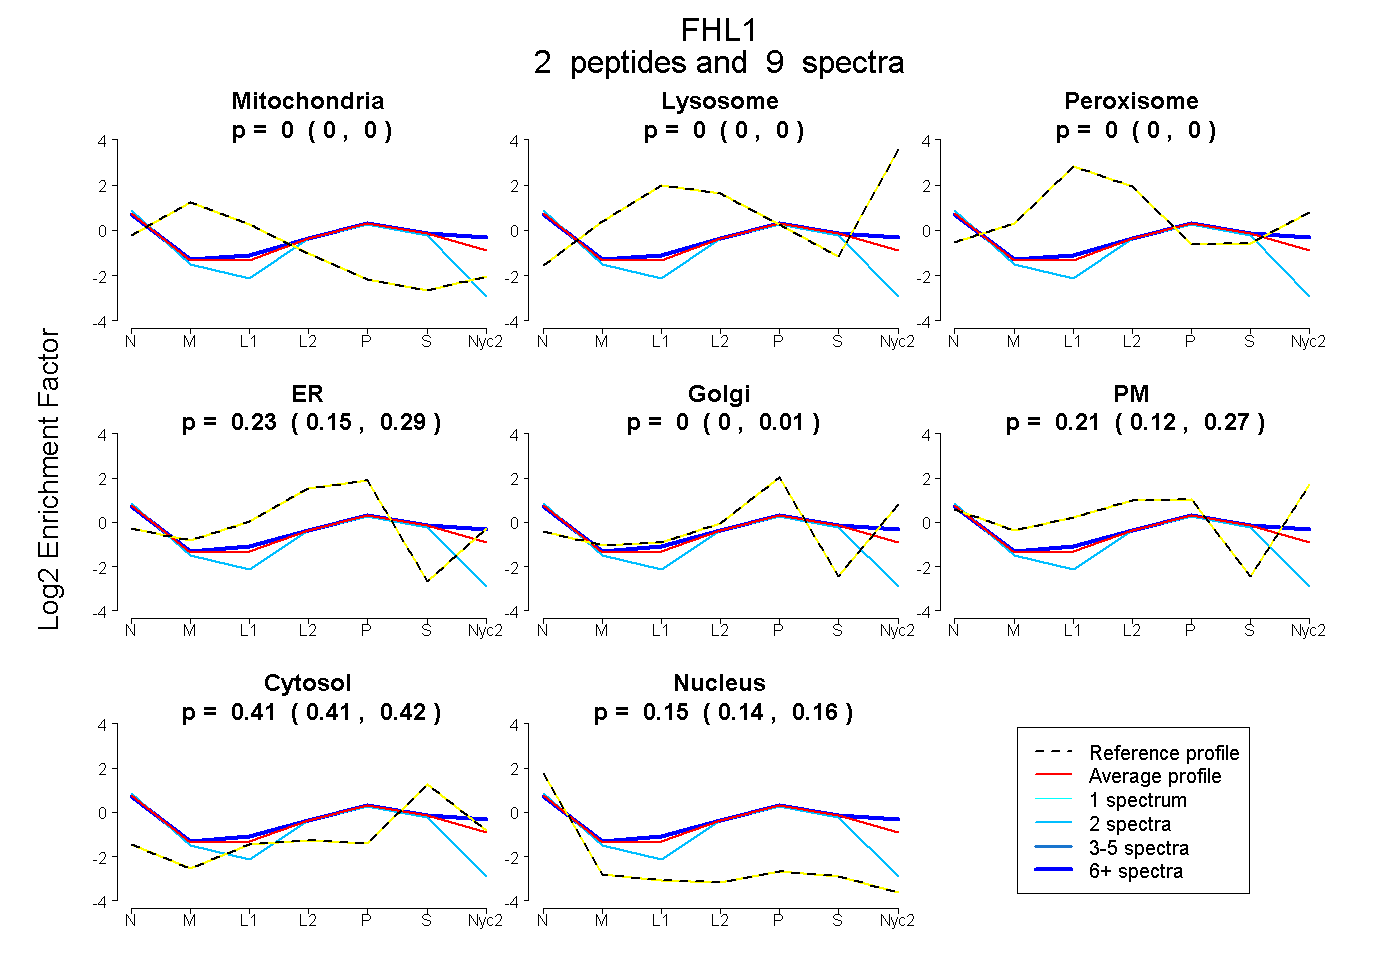
| Expt A |
2 peptides |
9 spectra |
|
0.000 0.000 | 0.000 |
0.000 0.000 | 0.000 |
0.000 0.000 | 0.000 |
0.228 0.152 | 0.291 |
0.000 0.000 | 0.014 |
0.208 0.124 | 0.270 |
0.414 0.408 | 0.418 |
0.150 0.136 | 0.163 |
| 2 spectra, FCANTCVECR | 0.000 | 0.000 | 0.000 | 0.344 | 0.000 | 0.000 | 0.323 | 0.332 | ||
| 7 spectra, DPLQGK | 0.000 | 0.000 | 0.000 | 0.062 | 0.014 | 0.394 | 0.427 | 0.102 |
| Plot | Mito | Lyso or Perox | ER | Golgi | PM | Cytosol | Nucleus | ||||||
| Expt B |
1 peptide |
1 spectrum |
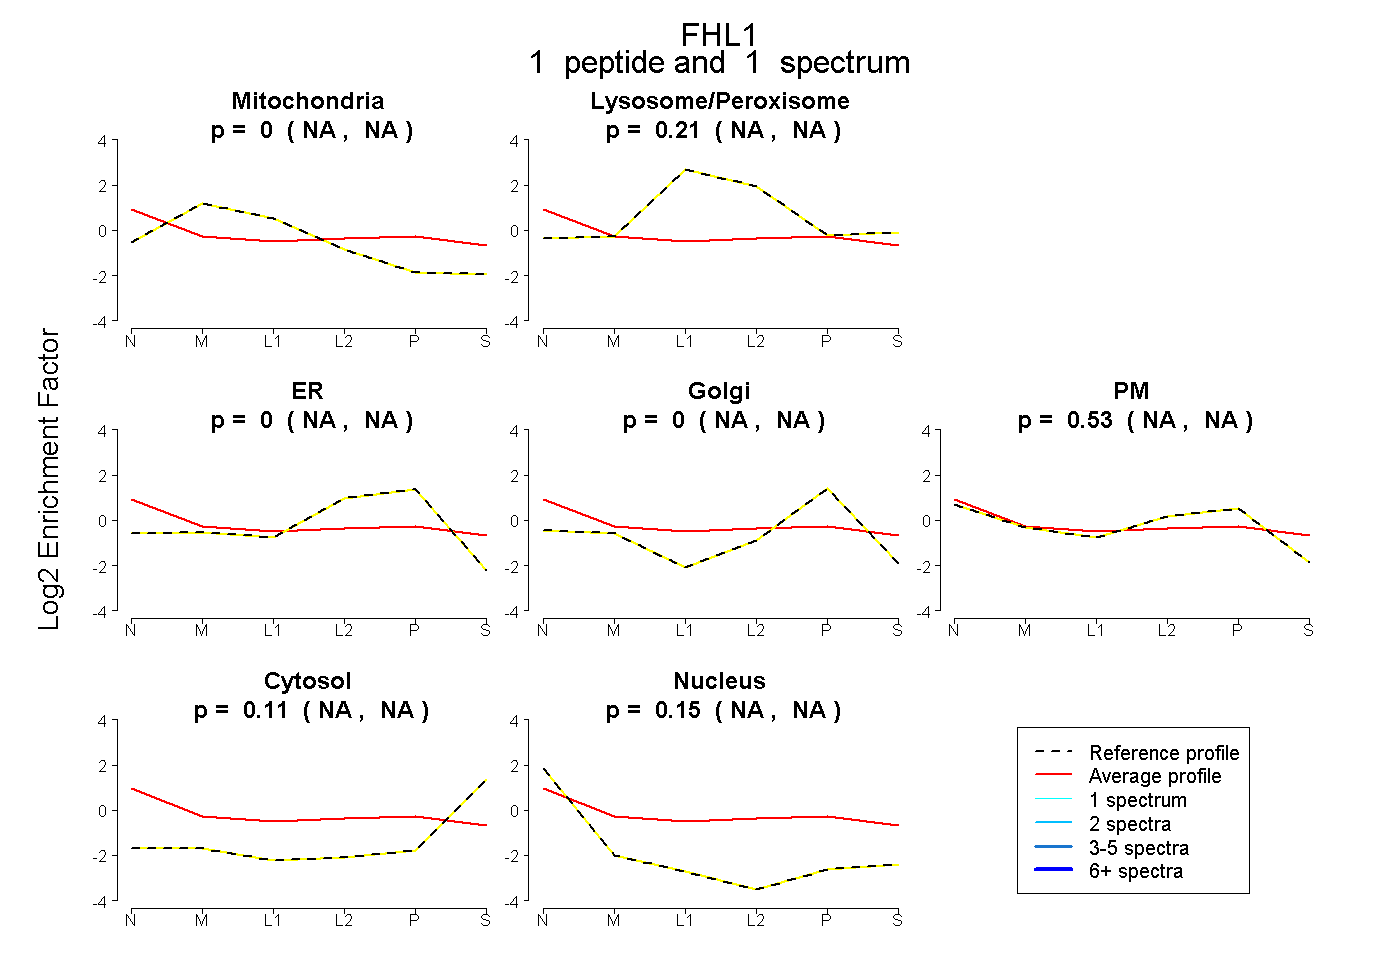 |
0.000 NA | NA |
0.213 NA | NA |
0.000 NA | NA |
0.000 NA | NA |
0.531 NA | NA |
0.111 NA | NA |
0.146 NA | NA |
|||
| Plot | Lyso | Other | |||||||||||
| Expt C |
2 peptides |
4 spectra |
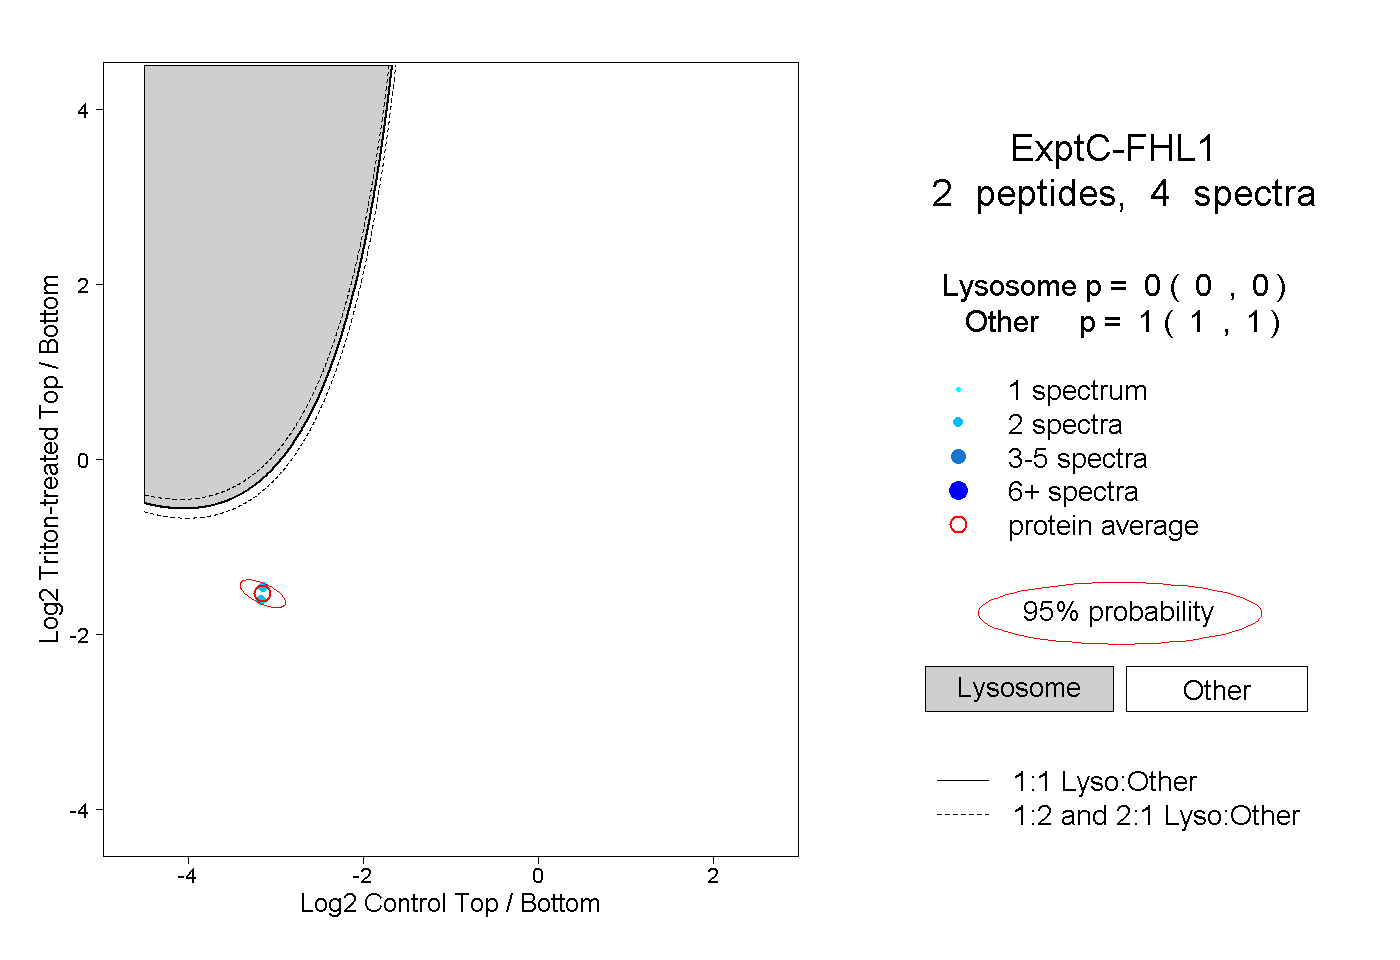 |
0.000 0.000 | 0.000 |
1.000 1.000 | 1.000 |