 4
4peptides
spectra
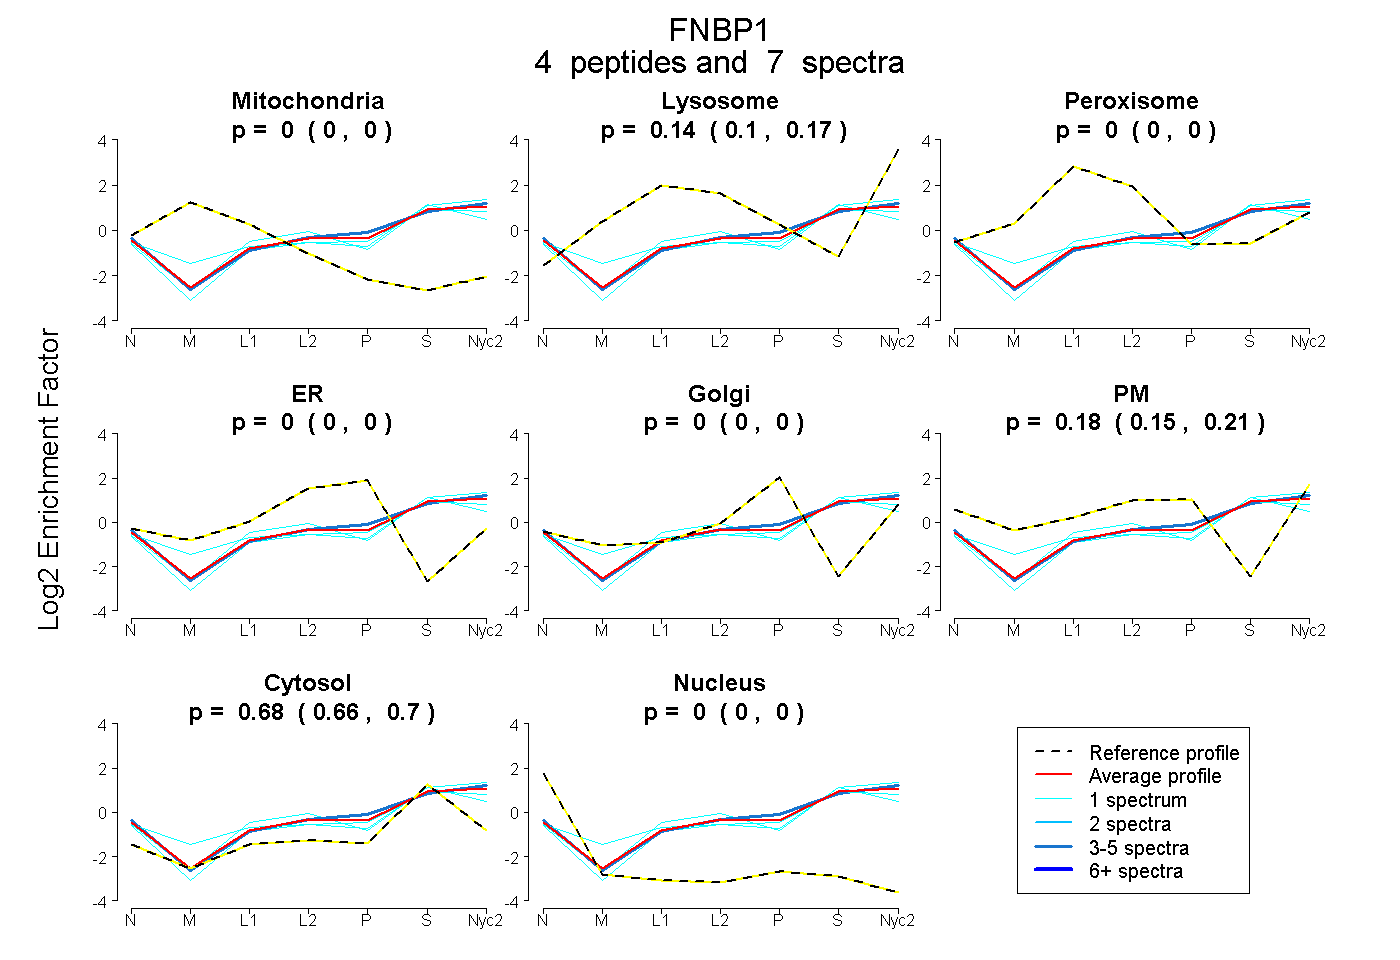
0.000 | 0.000
0.105 | 0.174
0.000 | 0.000
0.000 | 0.000
0.000 | 0.000
0.145 | 0.207
0.655 | 0.697
0.000 | 0.000
| Plot | Mito | Lyso | Perox | ER | Golgi | PM | Cytosol | Nucleus | |||||
| Expt A |
4 peptides |
7 spectra |
|
0.000 0.000 | 0.000 |
0.143 0.105 | 0.174 |
0.000 0.000 | 0.000 |
0.000 0.000 | 0.000 |
0.000 0.000 | 0.000 |
0.179 0.145 | 0.207 |
0.678 0.655 | 0.697 |
0.000 0.000 | 0.000 |
| 1 spectrum, FEAWLAEVEGR | 0.000 | 0.286 | 0.000 | 0.000 | 0.000 | 0.028 | 0.685 | 0.000 | ||
| 1 spectrum, EGKPELK | 0.000 | 0.077 | 0.000 | 0.000 | 0.000 | 0.121 | 0.802 | 0.000 | ||
| 1 spectrum, QVIPIIGK | 0.000 | 0.192 | 0.000 | 0.000 | 0.000 | 0.153 | 0.655 | 0.000 | ||
| 4 spectra, LWPFIK | 0.000 | 0.112 | 0.000 | 0.000 | 0.000 | 0.238 | 0.650 | 0.000 |
| Plot | Lyso | Other | |||||||||||
| Expt C |
8 peptides |
14 spectra |
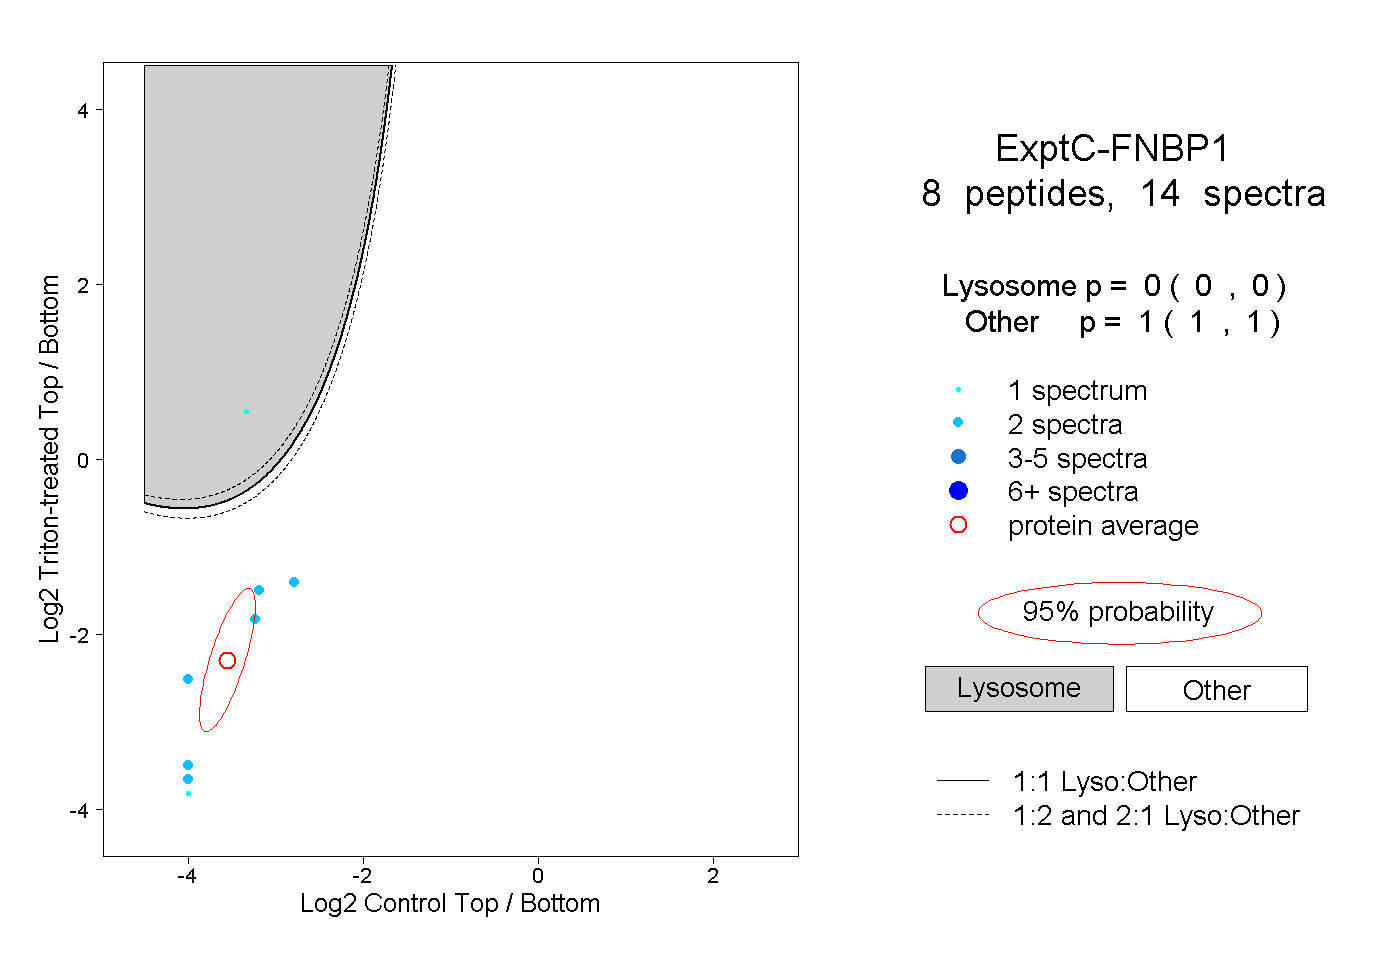 |
0.000 0.000 | 0.000 |
1.000 1.000 | 1.000 |