 2
2peptides
spectra
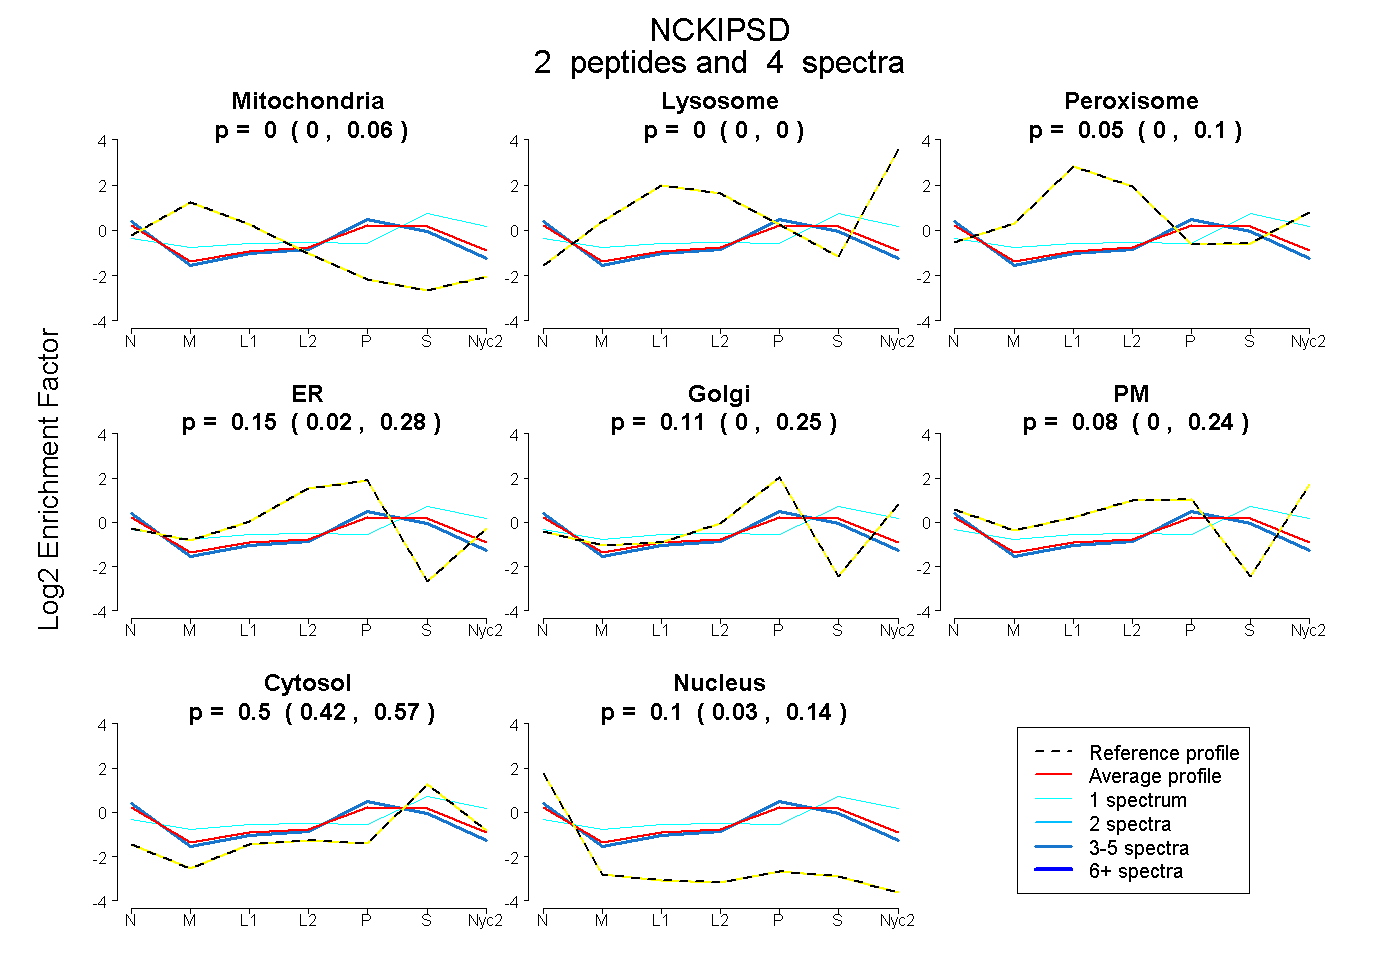
0.000 | 0.059
0.000 | 0.000
0.000 | 0.098
0.018 | 0.283
0.000 | 0.245
0.000 | 0.241
0.423 | 0.571
0.033 | 0.138
1peptide
spectra
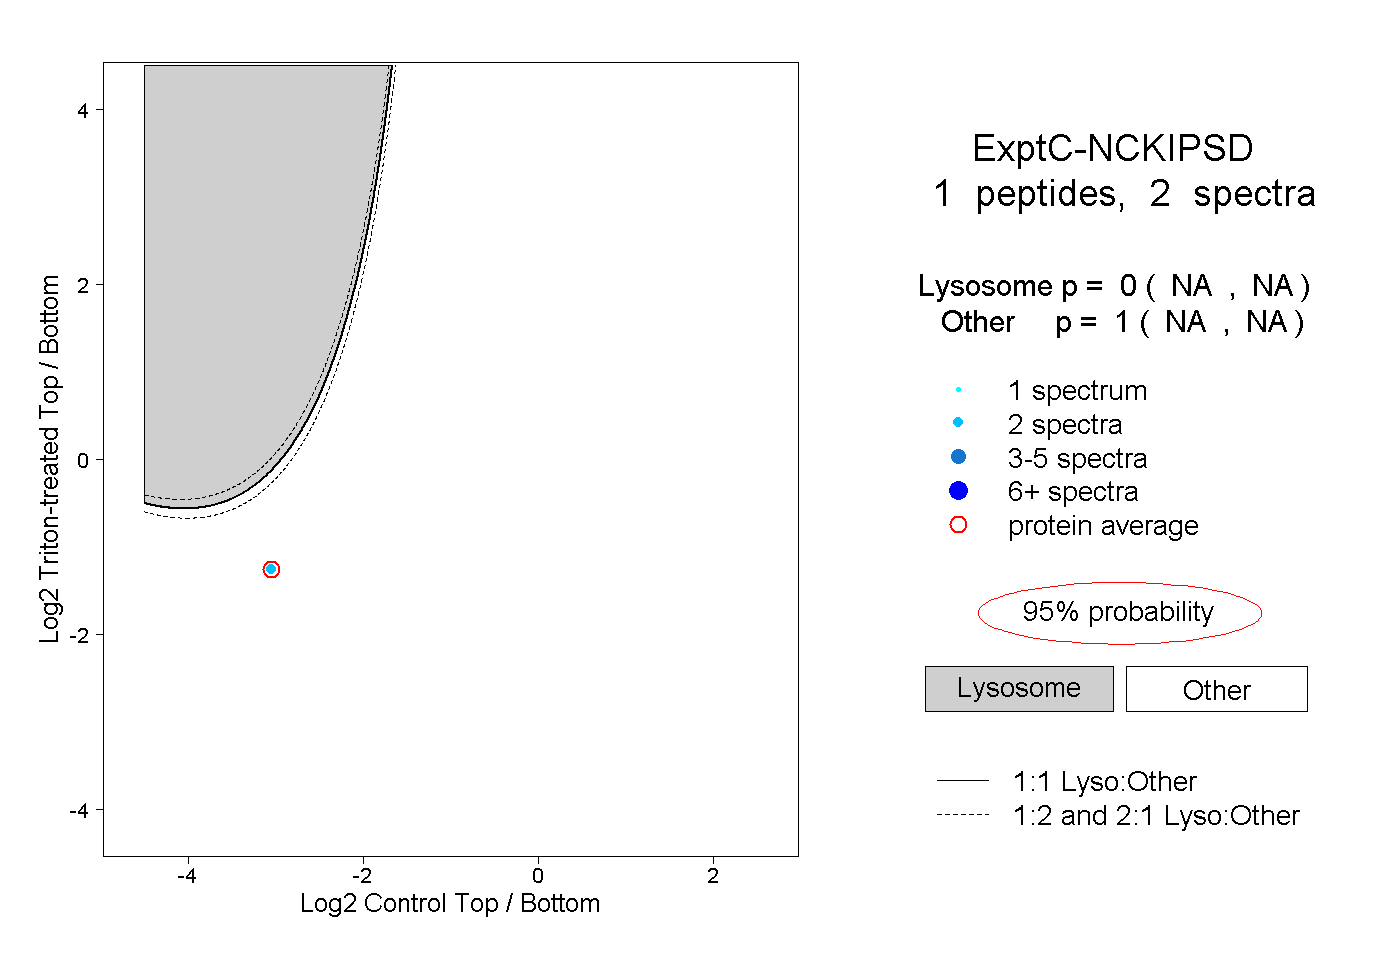
NA | NA
NA | NA
| Plot | Mito | Lyso | Perox | ER | Golgi | PM | Cytosol | Nucleus | |||||
| Expt A |
2 peptides |
4 spectra |
|
0.000 0.000 | 0.059 |
0.000 0.000 | 0.000 |
0.053 0.000 | 0.098 |
0.155 0.018 | 0.283 |
0.114 0.000 | 0.245 |
0.079 0.000 | 0.241 |
0.498 0.423 | 0.571 |
0.102 0.033 | 0.138 |
||
| Plot | Lyso | Other | |||||||||||
| Expt C |
1 peptide |
2 spectra |
|
0.000 NA | NA |
1.000 NA | NA |