 6
6peptides
spectra
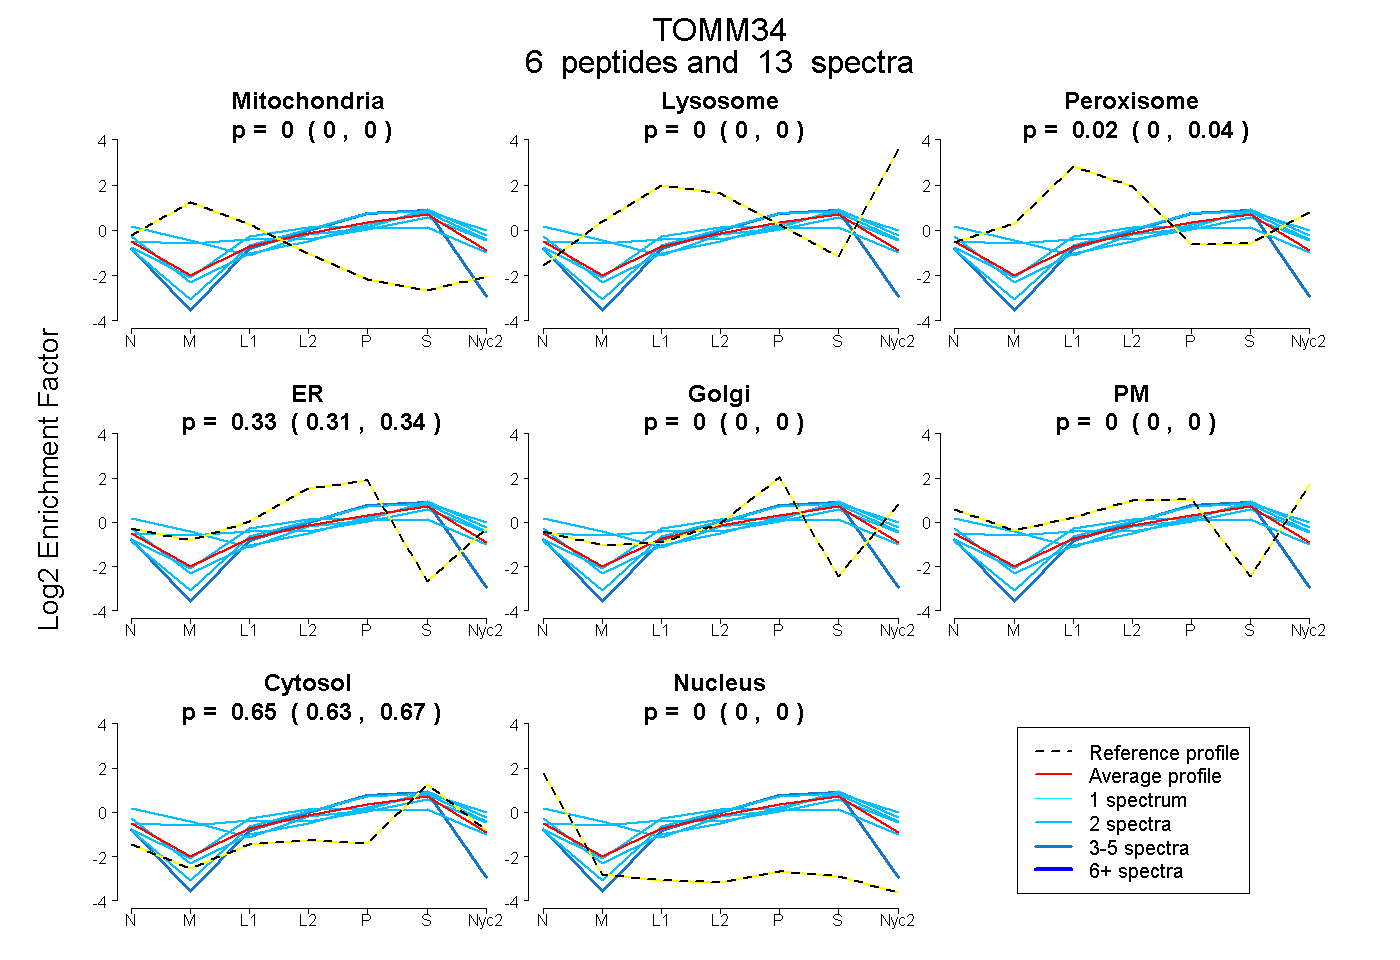
0.000 | 0.000
0.000 | 0.000
0.000 | 0.044
0.309 | 0.343
0.000 | 0.000
0.000 | 0.000
0.631 | 0.668
0.000 | 0.000
1peptide
spectrum
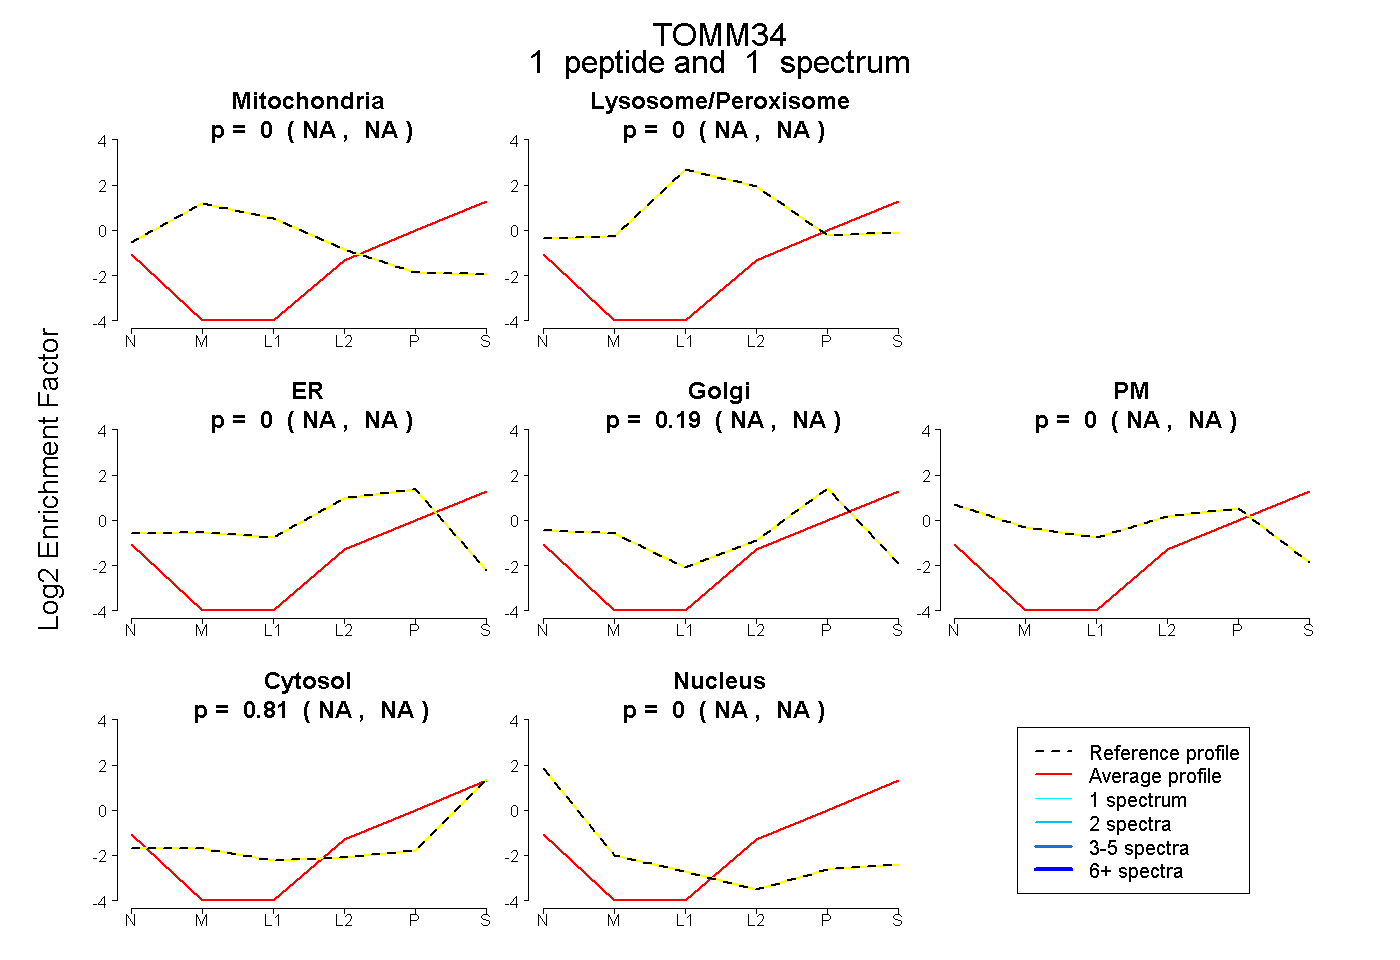
NA | NA
NA | NA
NA | NA
NA | NA
NA | NA
NA | NA
NA | NA
4peptides
spectra
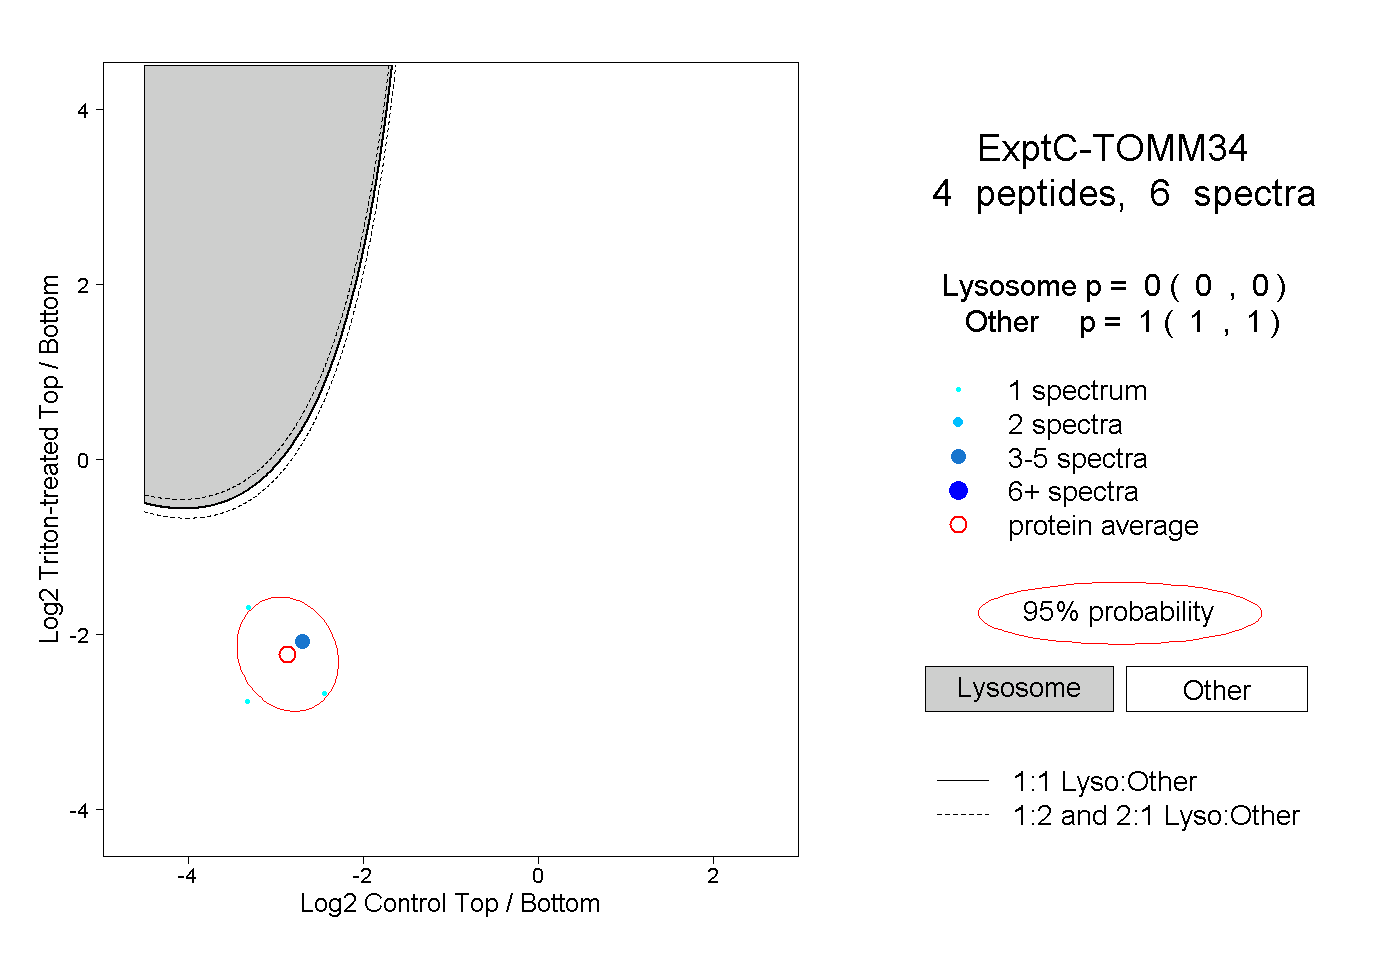
0.000 | 0.000
1.000 | 1.000
1peptide
spectrum
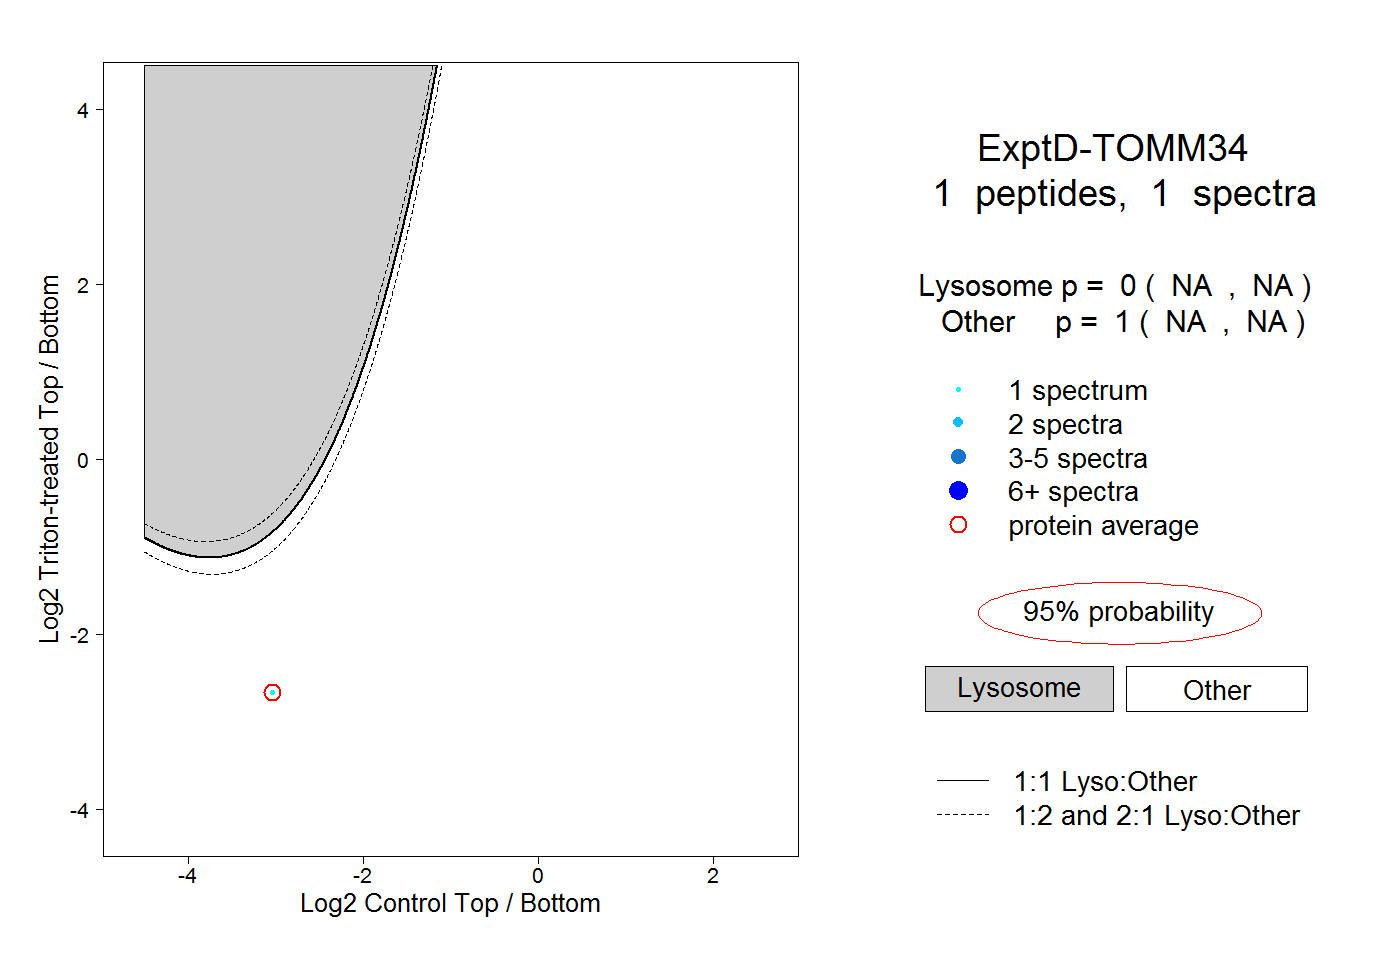
NA | NA
NA | NA