 18
18peptides
spectra
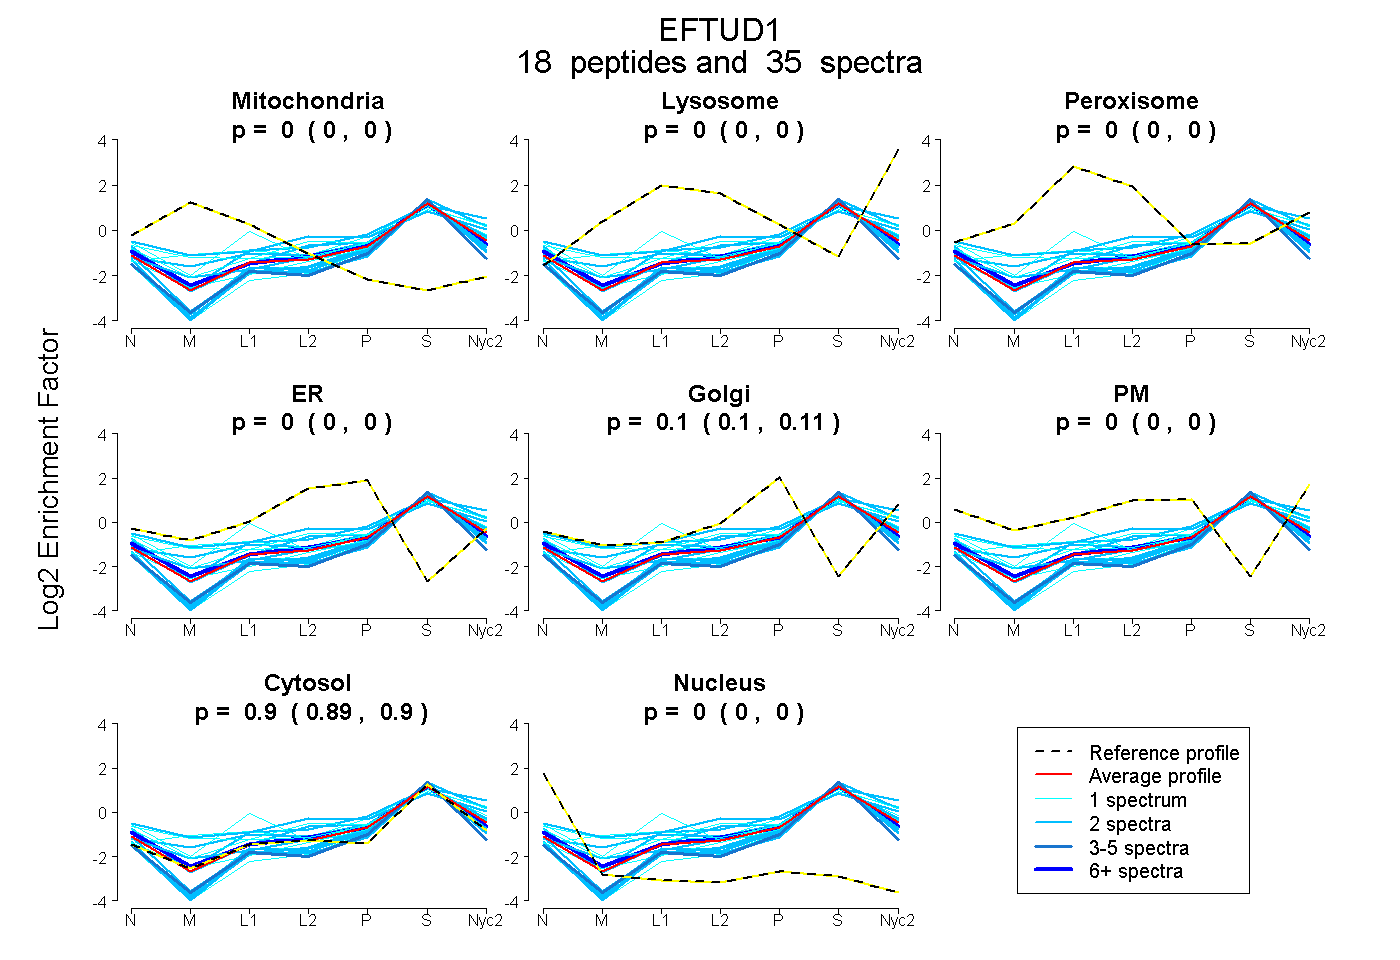
0.000 | 0.000
0.000 | 0.000
0.000 | 0.000
0.000 | 0.000
0.097 | 0.107
0.000 | 0.000
0.892 | 0.902
0.000 | 0.000
4peptides
spectra
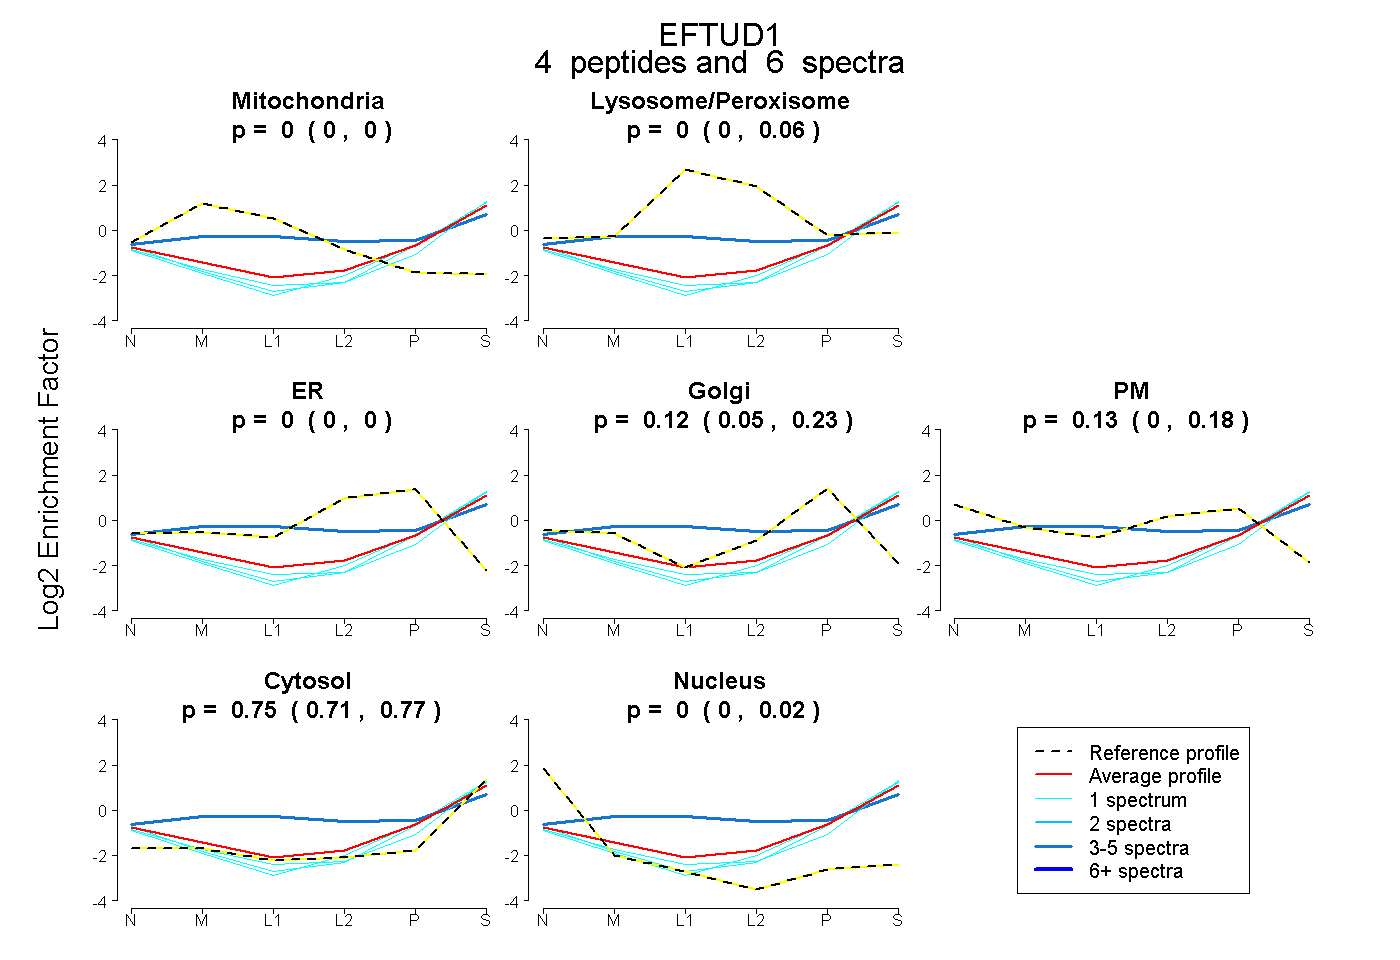
0.000 | 0.000
0.000 | 0.061
0.000 | 0.000
0.048 | 0.230
0.000 | 0.180
0.711 | 0.770
0.000 | 0.020
10peptides
spectra
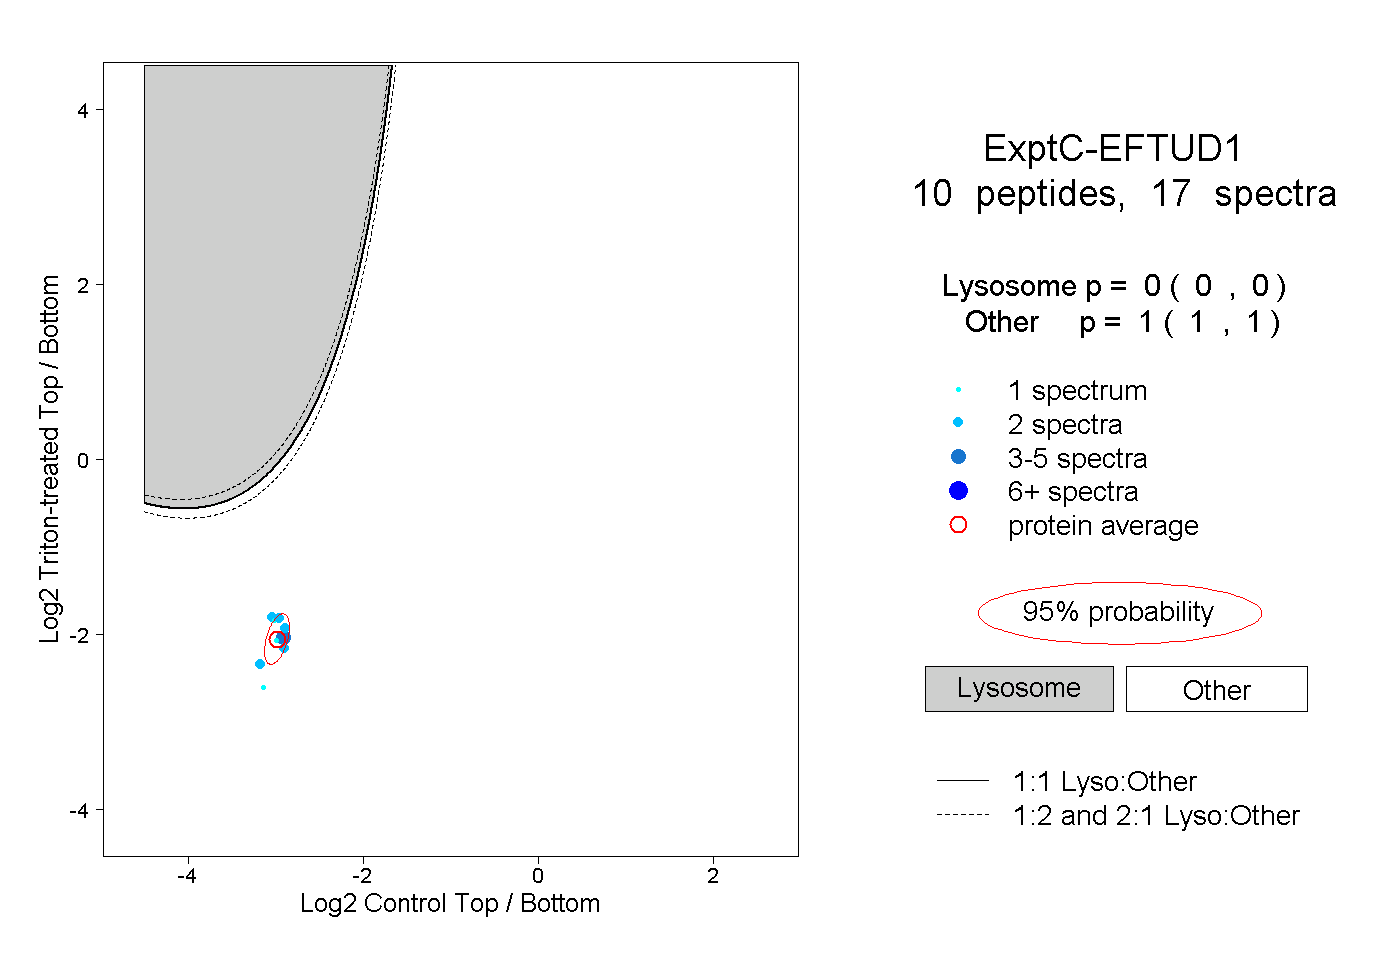
0.000 | 0.000
1.000 | 1.000
1peptide
spectrum
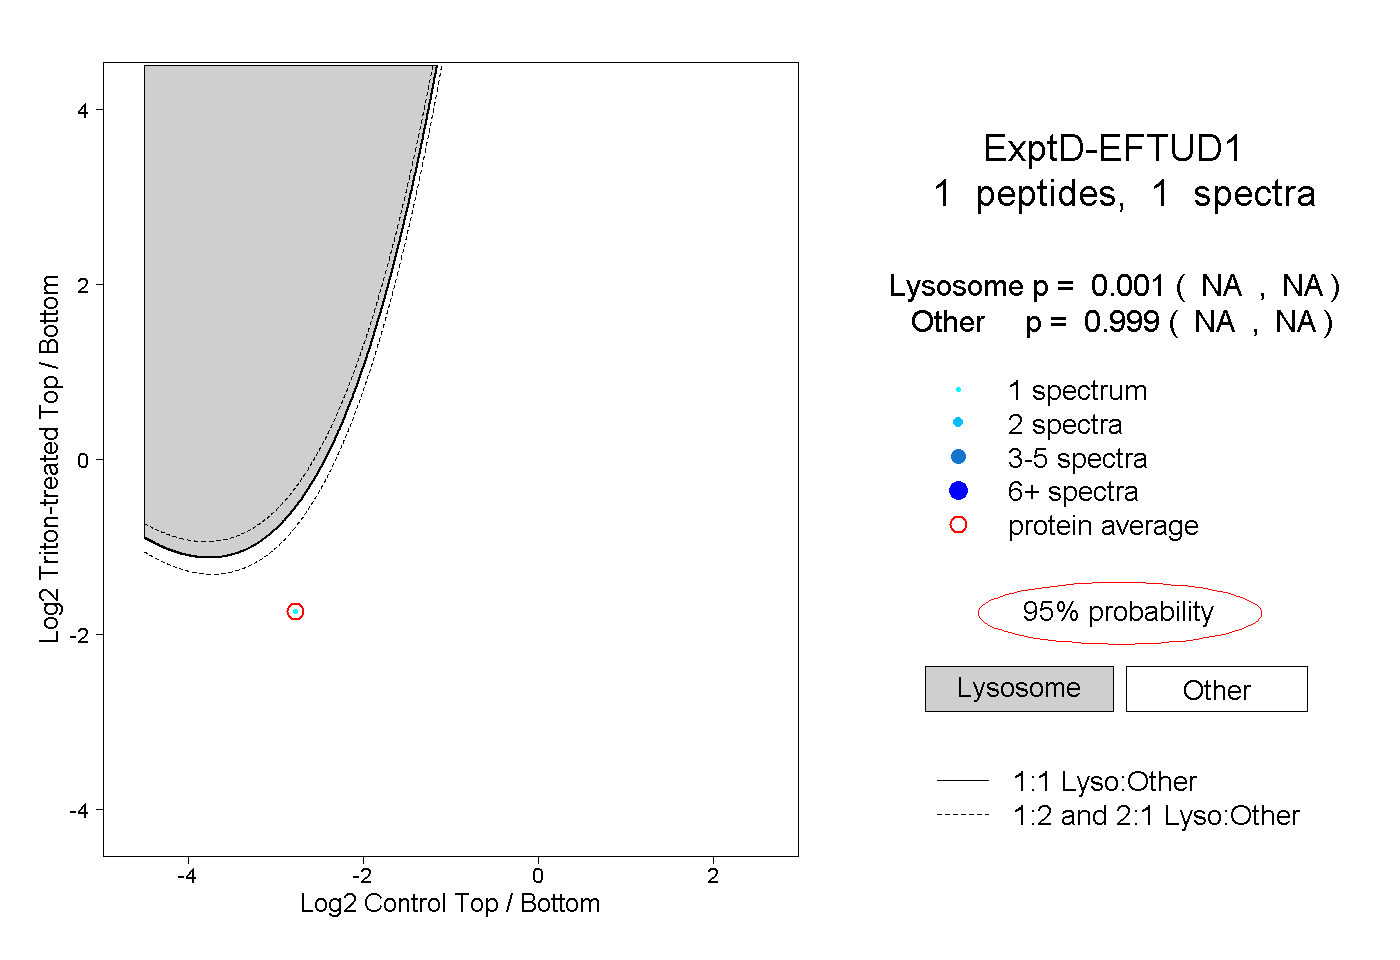
NA | NA
NA | NA