 18
18peptides
spectra
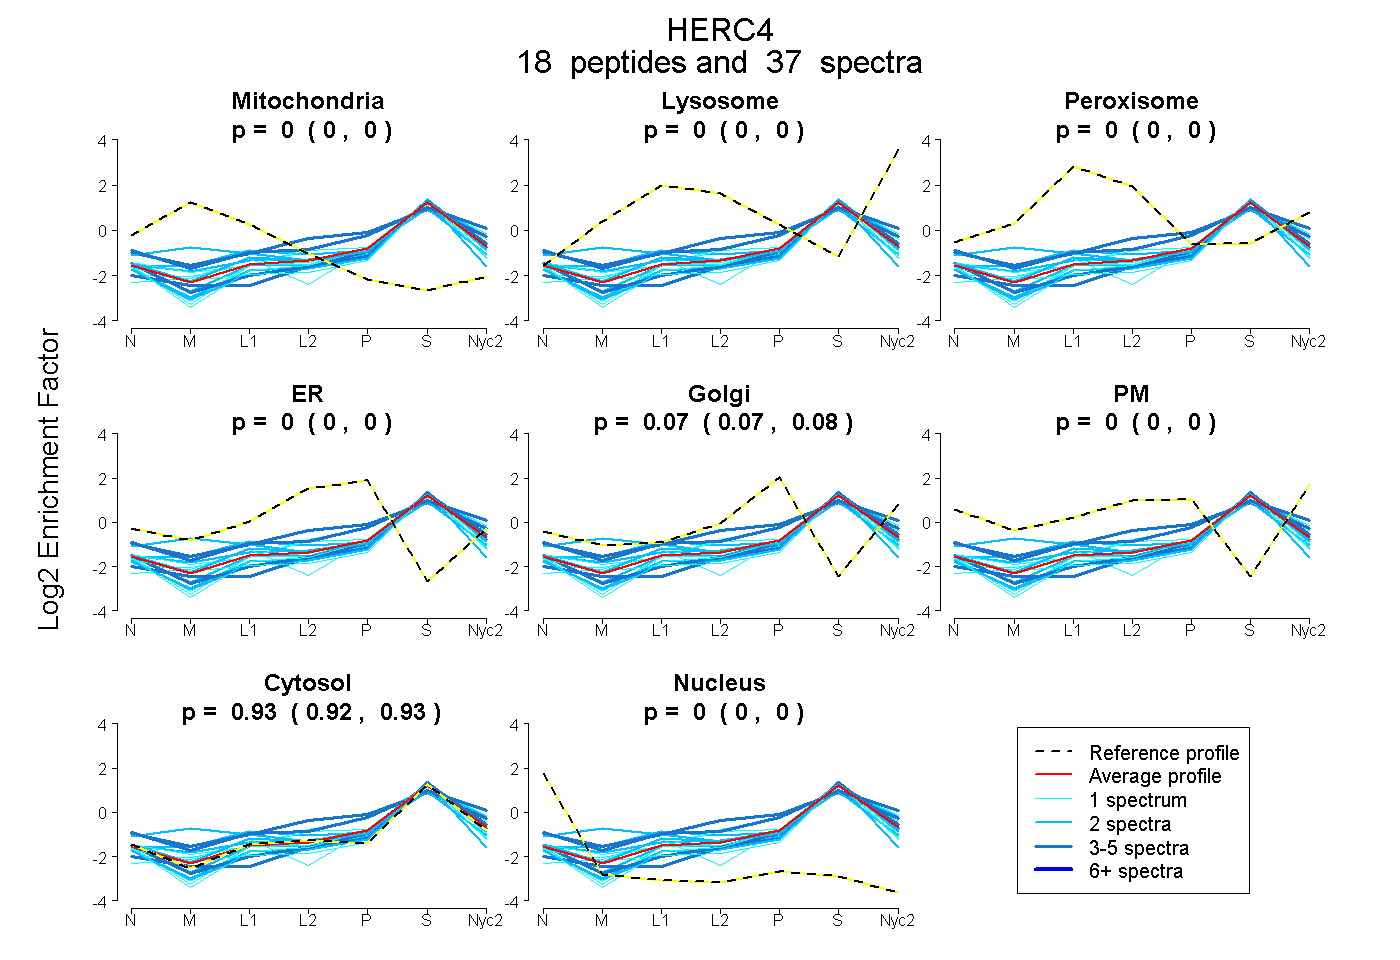
0.000 | 0.000
0.000 | 0.000
0.000 | 0.000
0.000 | 0.000
0.069 | 0.078
0.000 | 0.000
0.922 | 0.930
0.000 | 0.000
3peptides
spectra
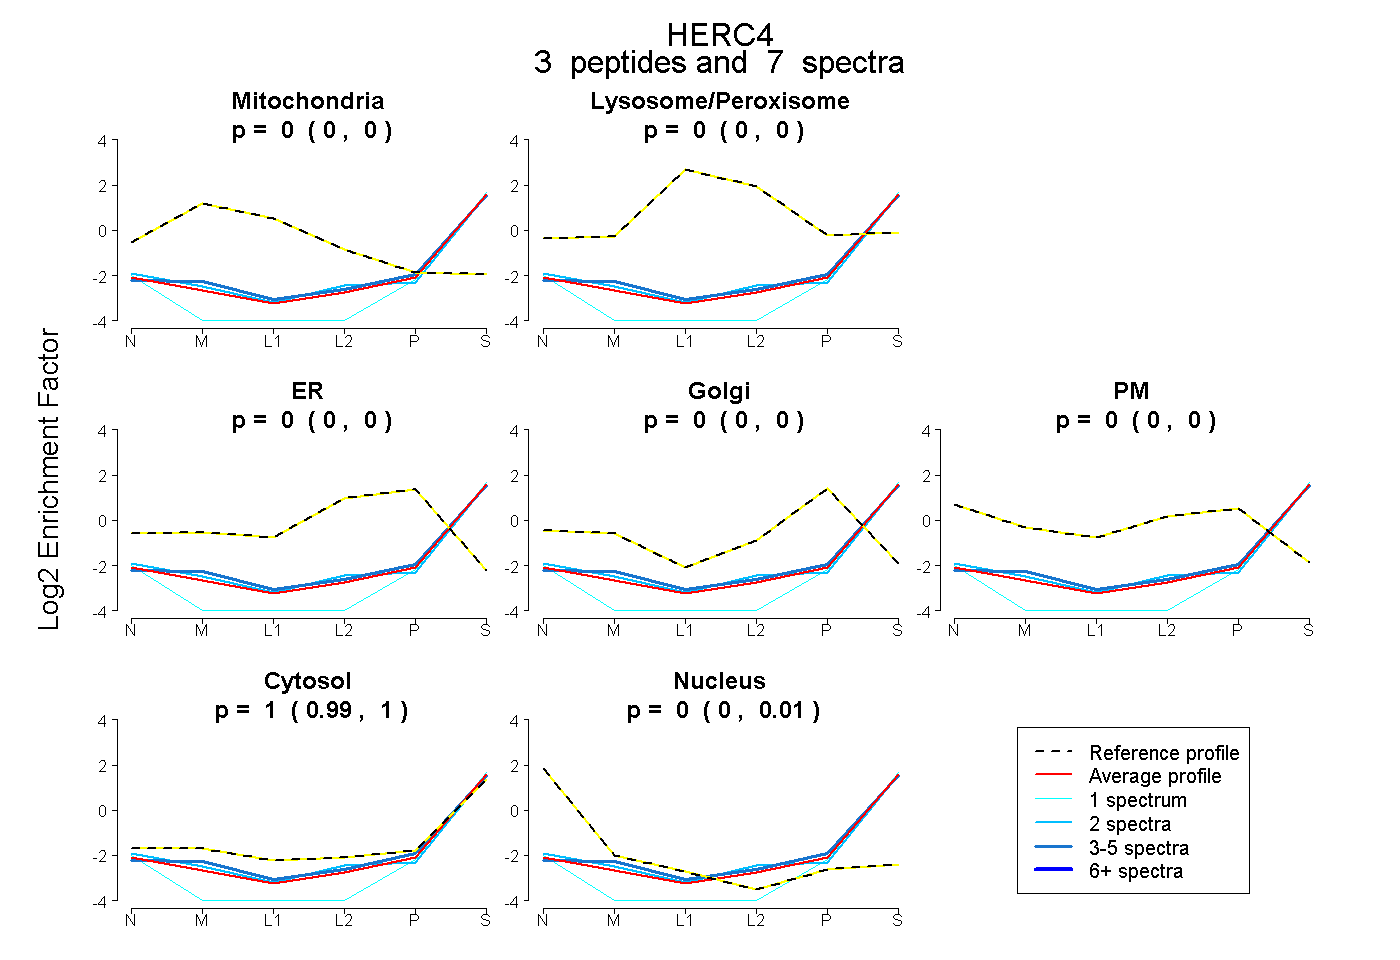
0.000 | 0.000
0.000 | 0.000
0.000 | 0.000
0.000 | 0.000
0.000 | 0.000
0.989 | 1.000
0.000 | 0.009
11peptides
spectra
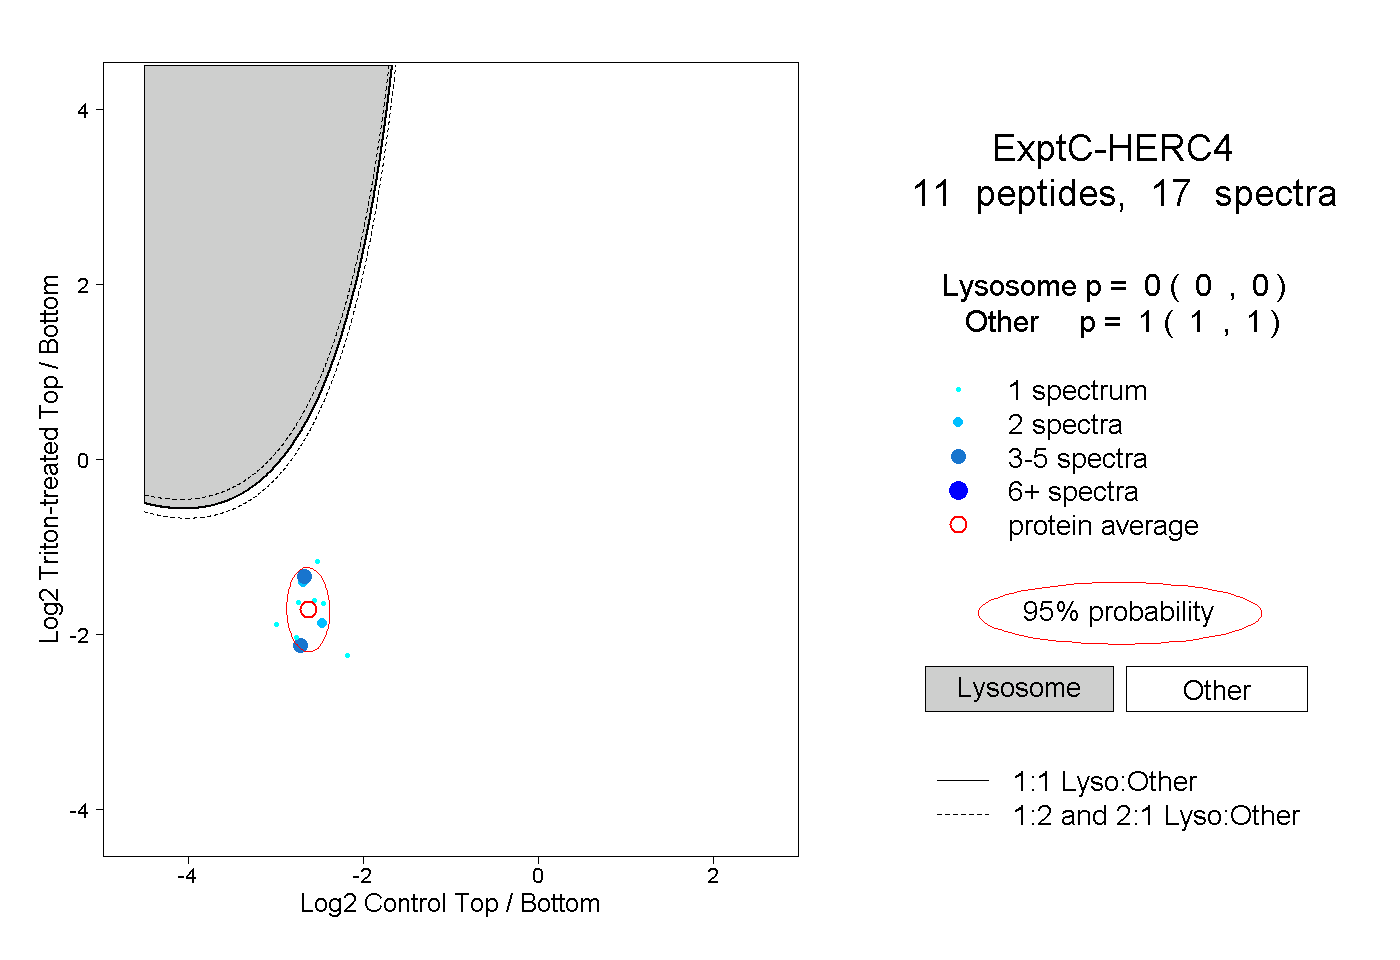
0.000 | 0.000
1.000 | 1.000