11
11peptides
spectra
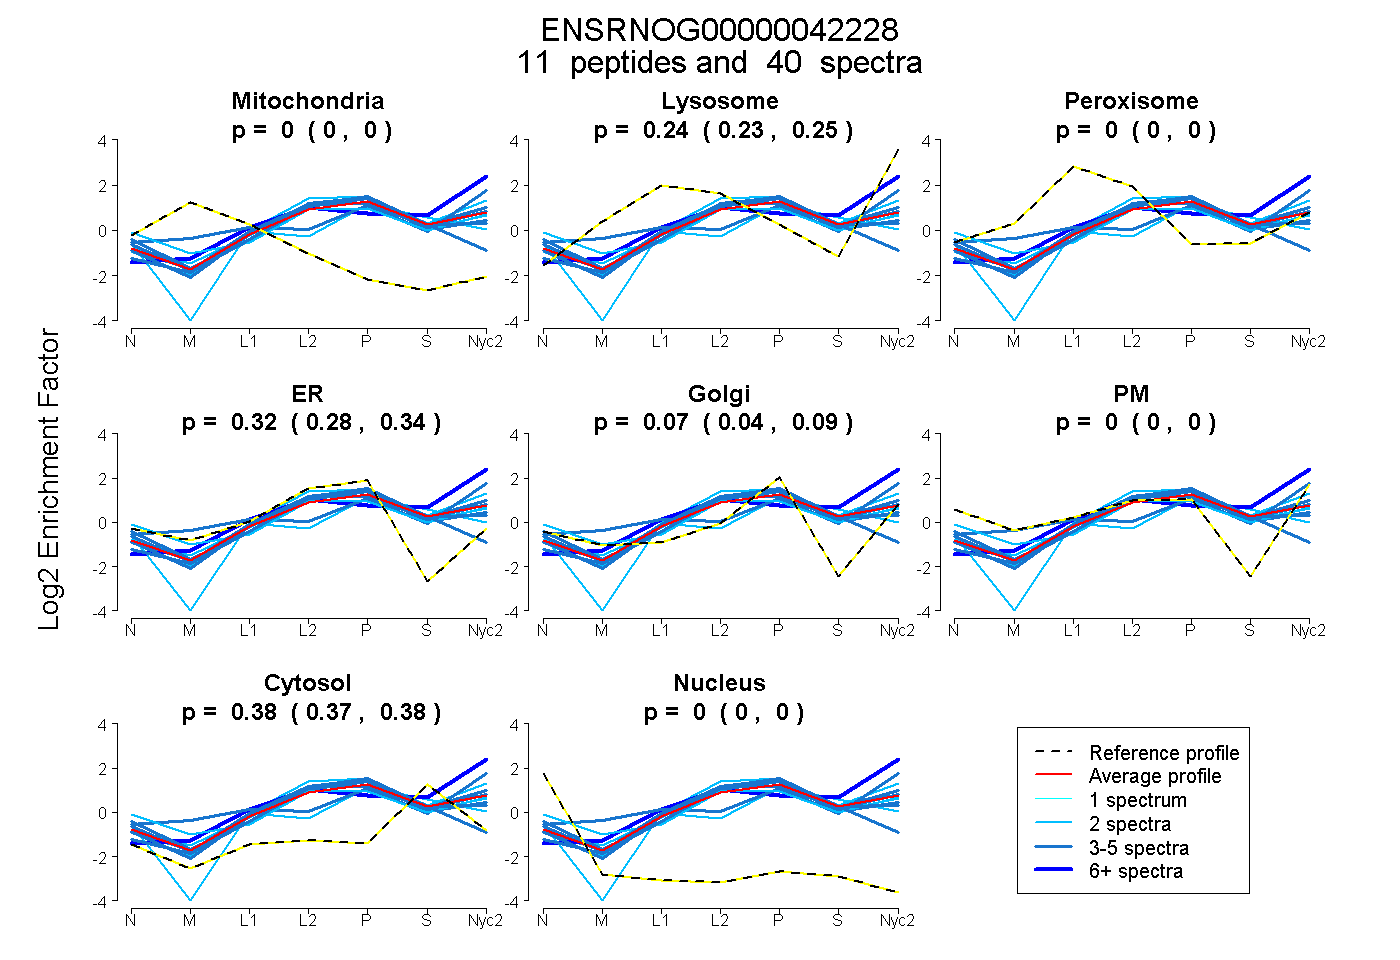
0.000 | 0.000
0.228 | 0.251
0.000 | 0.000
0.284 | 0.341
0.039 | 0.089
0.000 | 0.000
0.370 | 0.384
0.000 | 0.000
6peptides
spectra
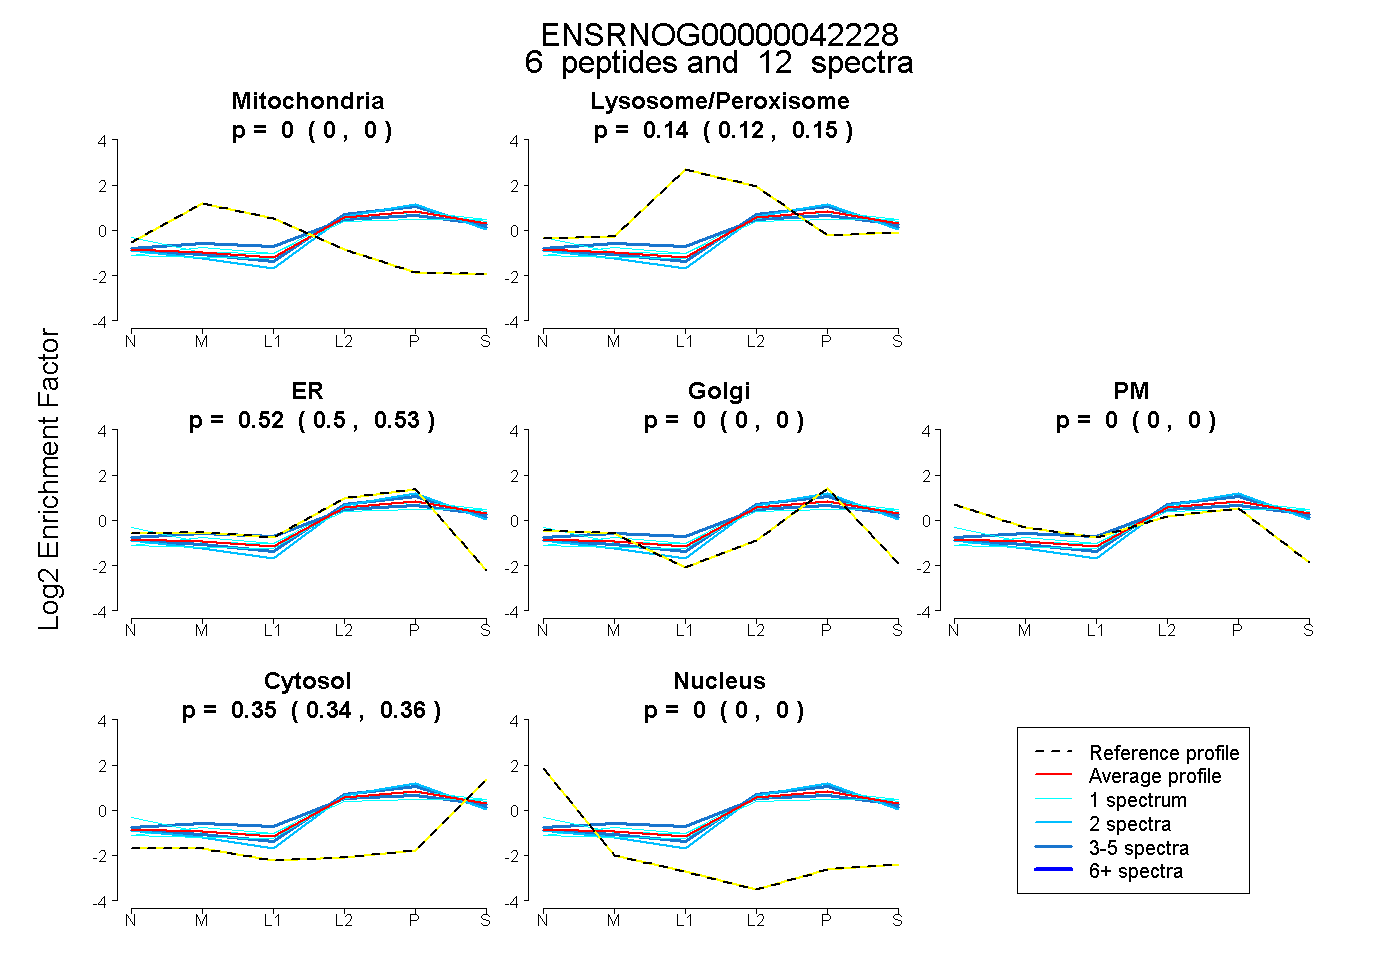
0.000 | 0.000
0.120 | 0.152
0.500 | 0.529
0.000 | 0.000
0.000 | 0.000
0.339 | 0.355
0.000 | 0.000
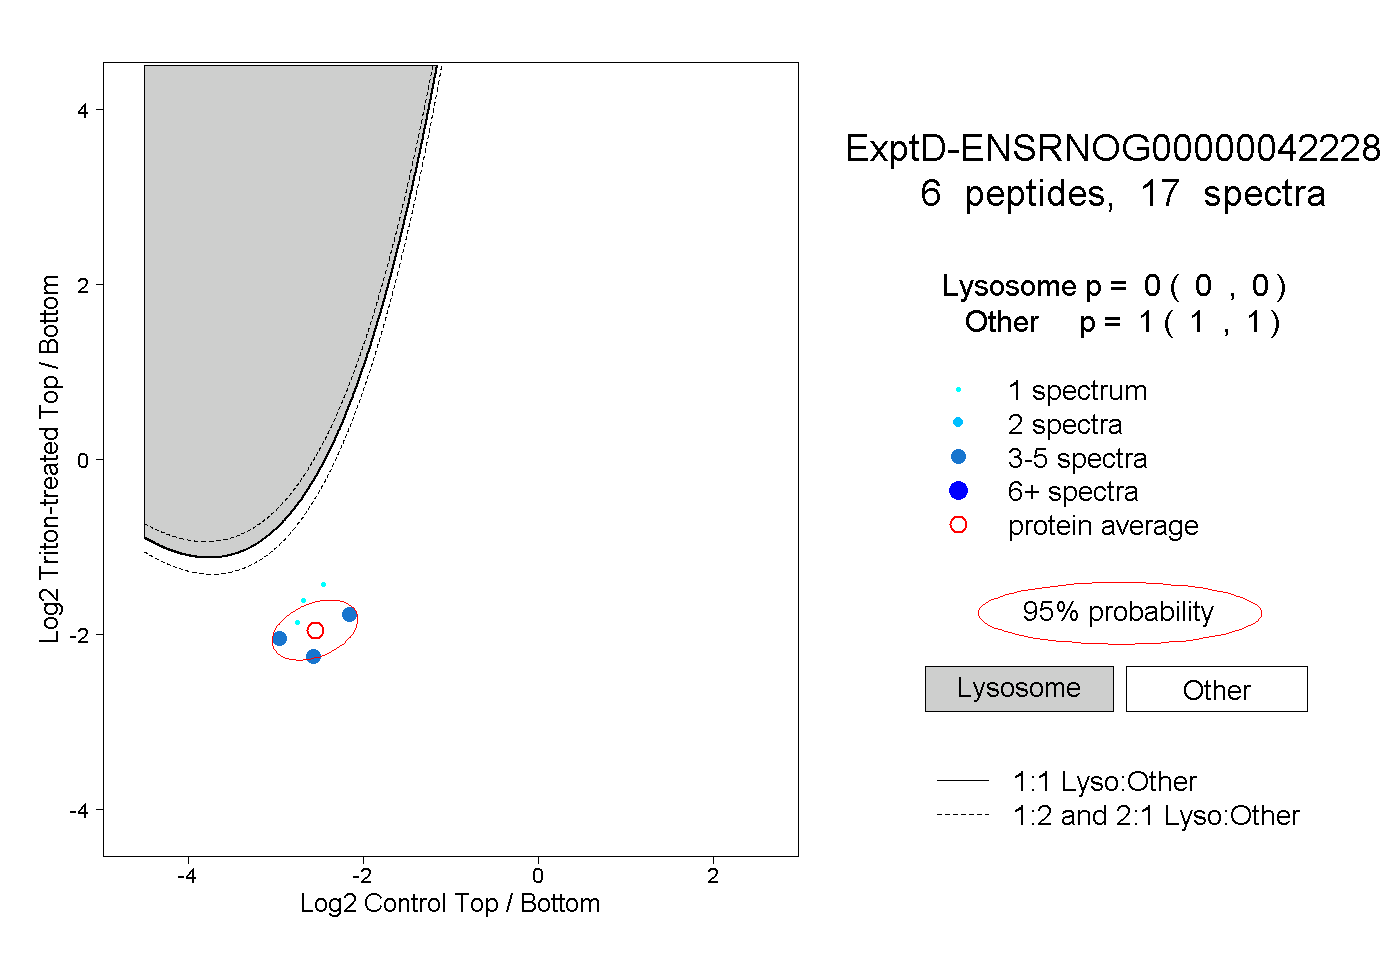
12peptides
spectra
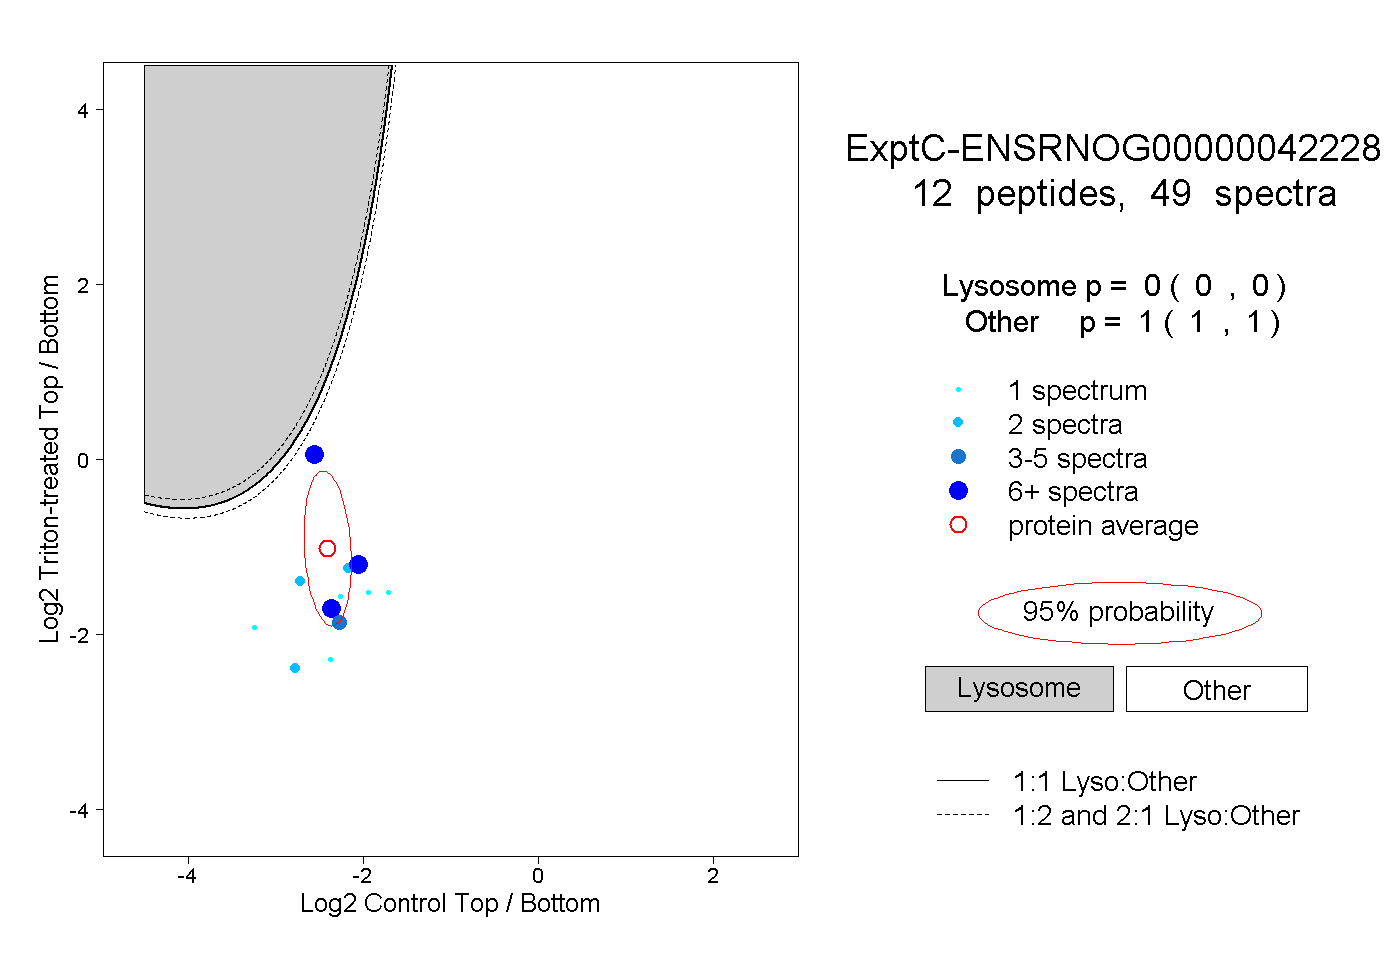
0.000 | 0.000
1.000 | 1.000