 11
11peptides
spectra
0.000 | 0.000
0.228 | 0.251
0.000 | 0.000
0.284 | 0.341
0.039 | 0.089
0.000 | 0.000
0.370 | 0.384
0.000 | 0.000
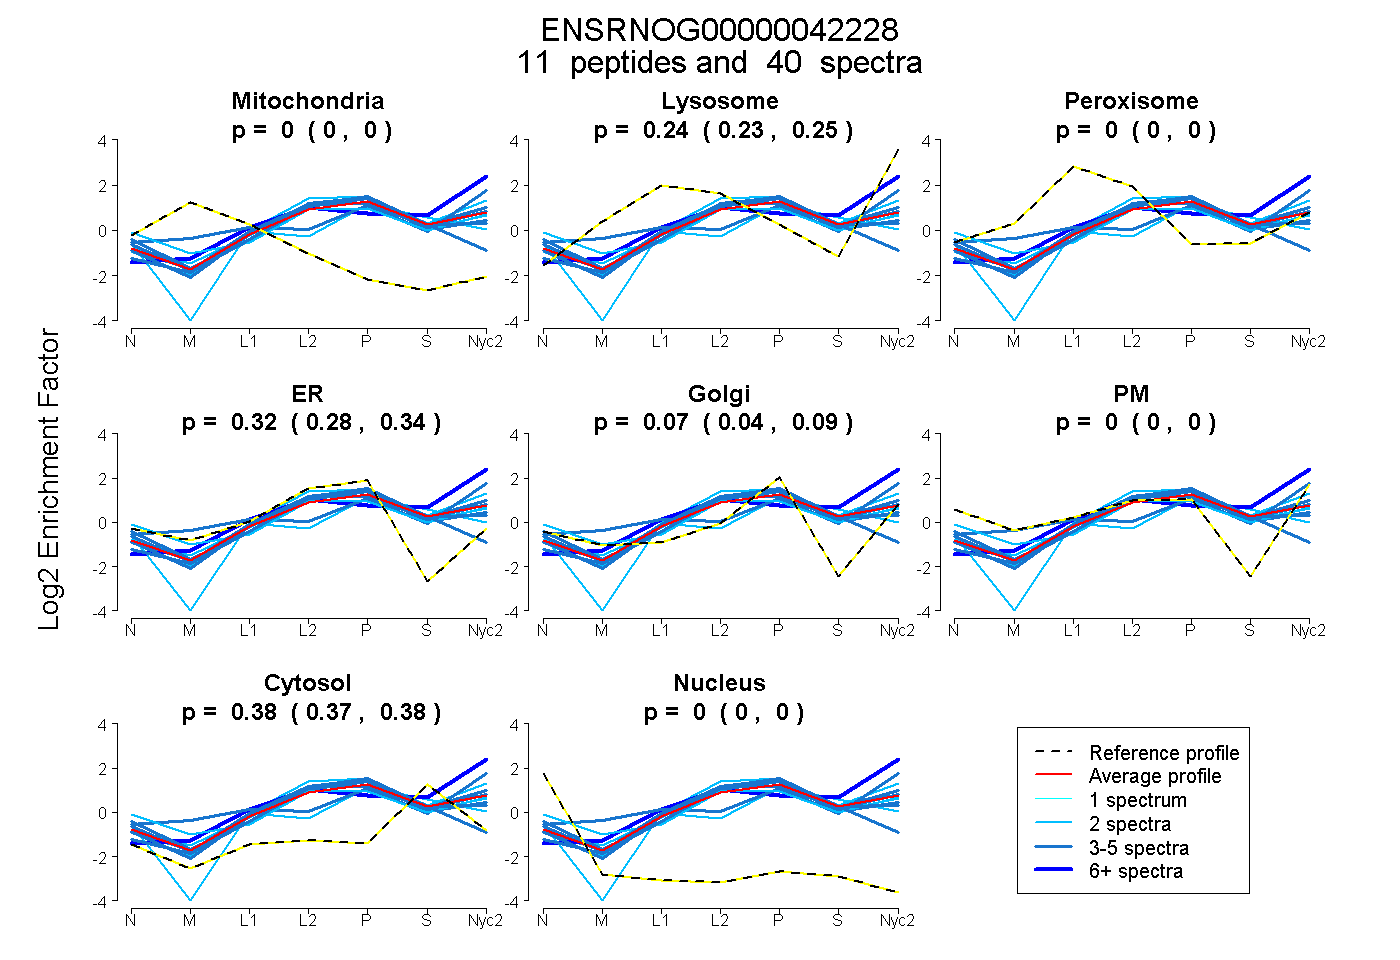
| Plot | Mito | Lyso | Perox | ER | Golgi | PM | Cytosol | Nucleus | |||||
| Expt A |
11 peptides |
40 spectra |
|
0.000 0.000 | 0.000 |
0.240 0.228 | 0.251 |
0.000 0.000 | 0.000 |
0.316 0.284 | 0.341 |
0.066 0.039 | 0.089 |
0.000 0.000 | 0.000 |
0.377 0.370 | 0.384 |
0.000 0.000 | 0.000 |
| 2 spectra, SHYPFEDEDGCVIYRPR | 0.000 | 0.109 | 0.000 | 0.227 | 0.000 | 0.308 | 0.355 | 0.000 | ||
| 3 spectra, LTYSVPYGR | 0.000 | 0.144 | 0.000 | 0.449 | 0.055 | 0.000 | 0.353 | 0.000 | ||
| 3 spectra, TPSVTVQSSGSFFQK | 0.000 | 0.255 | 0.000 | 0.382 | 0.000 | 0.000 | 0.364 | 0.000 | ||
| 3 spectra, ISLCHGNPSFR | 0.000 | 0.408 | 0.000 | 0.000 | 0.308 | 0.036 | 0.249 | 0.000 | ||
| 12 spectra, IMQWQDIK | 0.000 | 0.582 | 0.000 | 0.000 | 0.064 | 0.000 | 0.354 | 0.000 | ||
| 4 spectra, FSIDTSGISR | 0.000 | 0.251 | 0.000 | 0.283 | 0.125 | 0.000 | 0.340 | 0.000 | ||
| 2 spectra, EENSCIHSSCTAER | 0.000 | 0.013 | 0.145 | 0.035 | 0.327 | 0.000 | 0.480 | 0.000 | ||
| 2 spectra, DTGLTALTNLK | 0.000 | 0.217 | 0.000 | 0.438 | 0.016 | 0.000 | 0.329 | 0.000 | ||
| 2 spectra, GDPIPNQQVFIK | 0.000 | 0.195 | 0.000 | 0.321 | 0.073 | 0.000 | 0.411 | 0.000 | ||
| 3 spectra, TFCFDYDMVPLAVPAAR | 0.000 | 0.000 | 0.014 | 0.550 | 0.000 | 0.000 | 0.436 | 0.000 | ||
| 4 spectra, SSDLFNSDGYGSWR | 0.000 | 0.148 | 0.000 | 0.462 | 0.000 | 0.000 | 0.391 | 0.000 |
| Plot | Mito | Lyso or Perox | ER | Golgi | PM | Cytosol | Nucleus | ||||||
| Expt B |
6 peptides |
12 spectra |
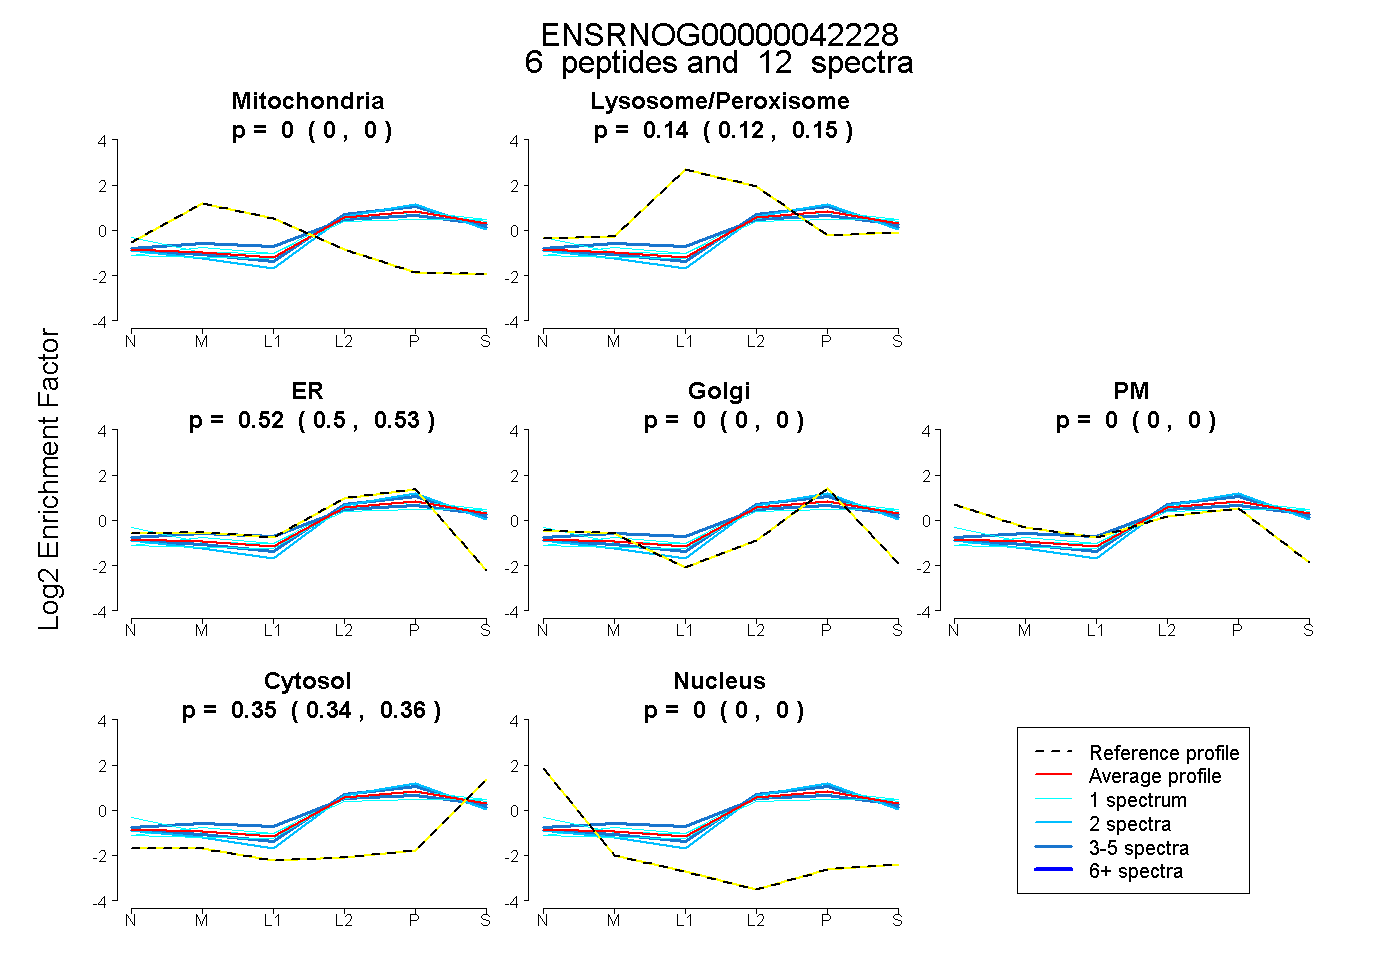 |
0.000 0.000 | 0.000 |
0.137 0.120 | 0.152 |
0.516 0.500 | 0.529 |
0.000 0.000 | 0.000 |
0.000 0.000 | 0.000 |
0.347 0.339 | 0.355 |
0.000 0.000 | 0.000 |
|||
| Plot | Lyso | Other | |||||||||||
| Expt C |
12 peptides |
49 spectra |
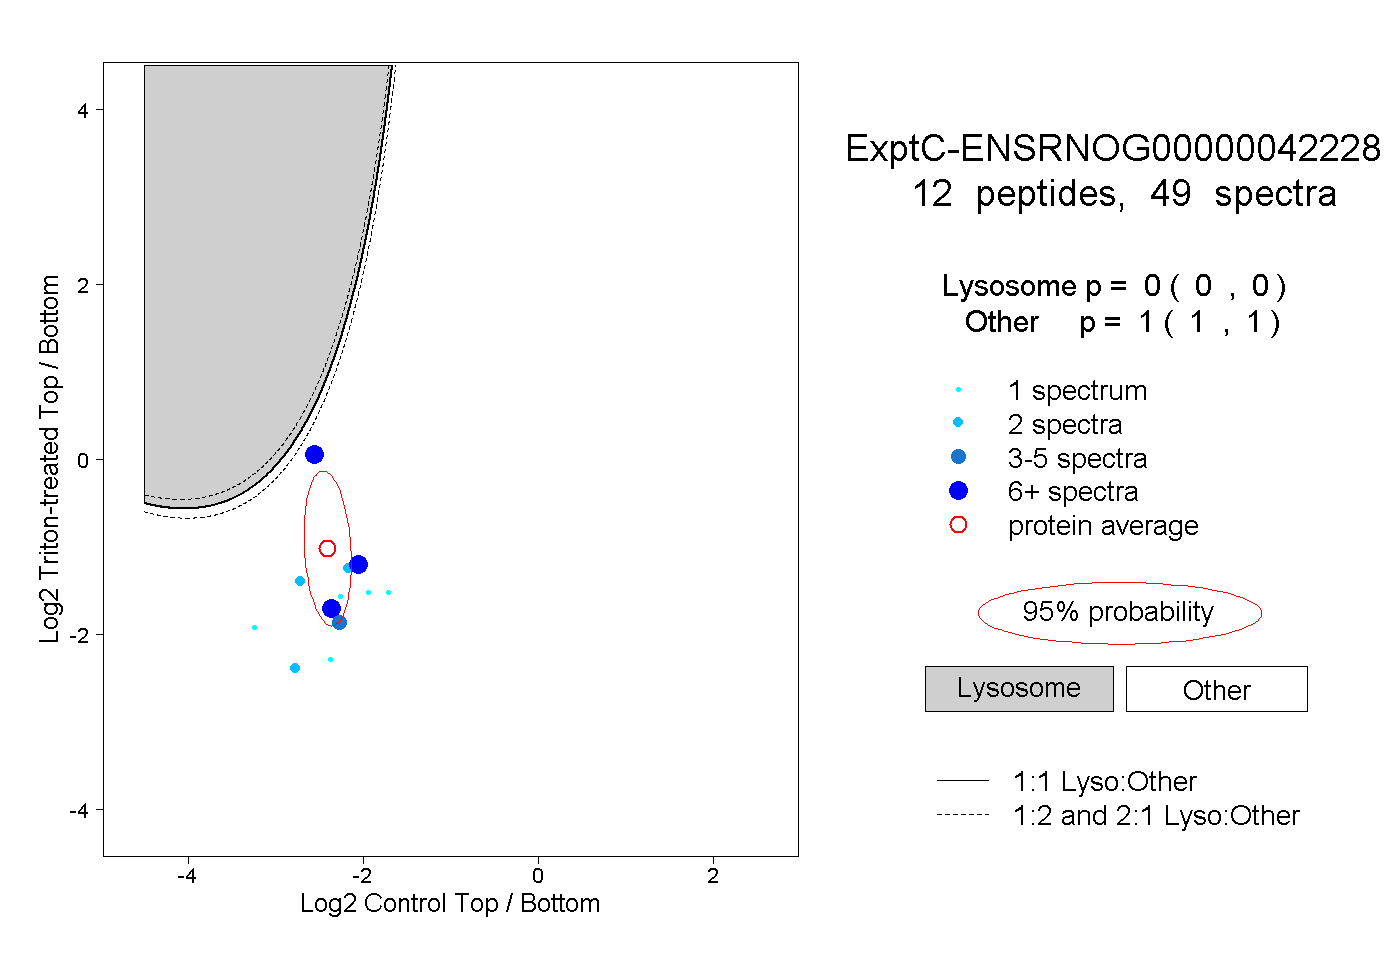 |
0.000 0.000 | 0.000 |
1.000 1.000 | 1.000 |
||||||||
| Plot | Lyso | Other | |||||||||||
| Expt D |
6 peptides |
17 spectra |
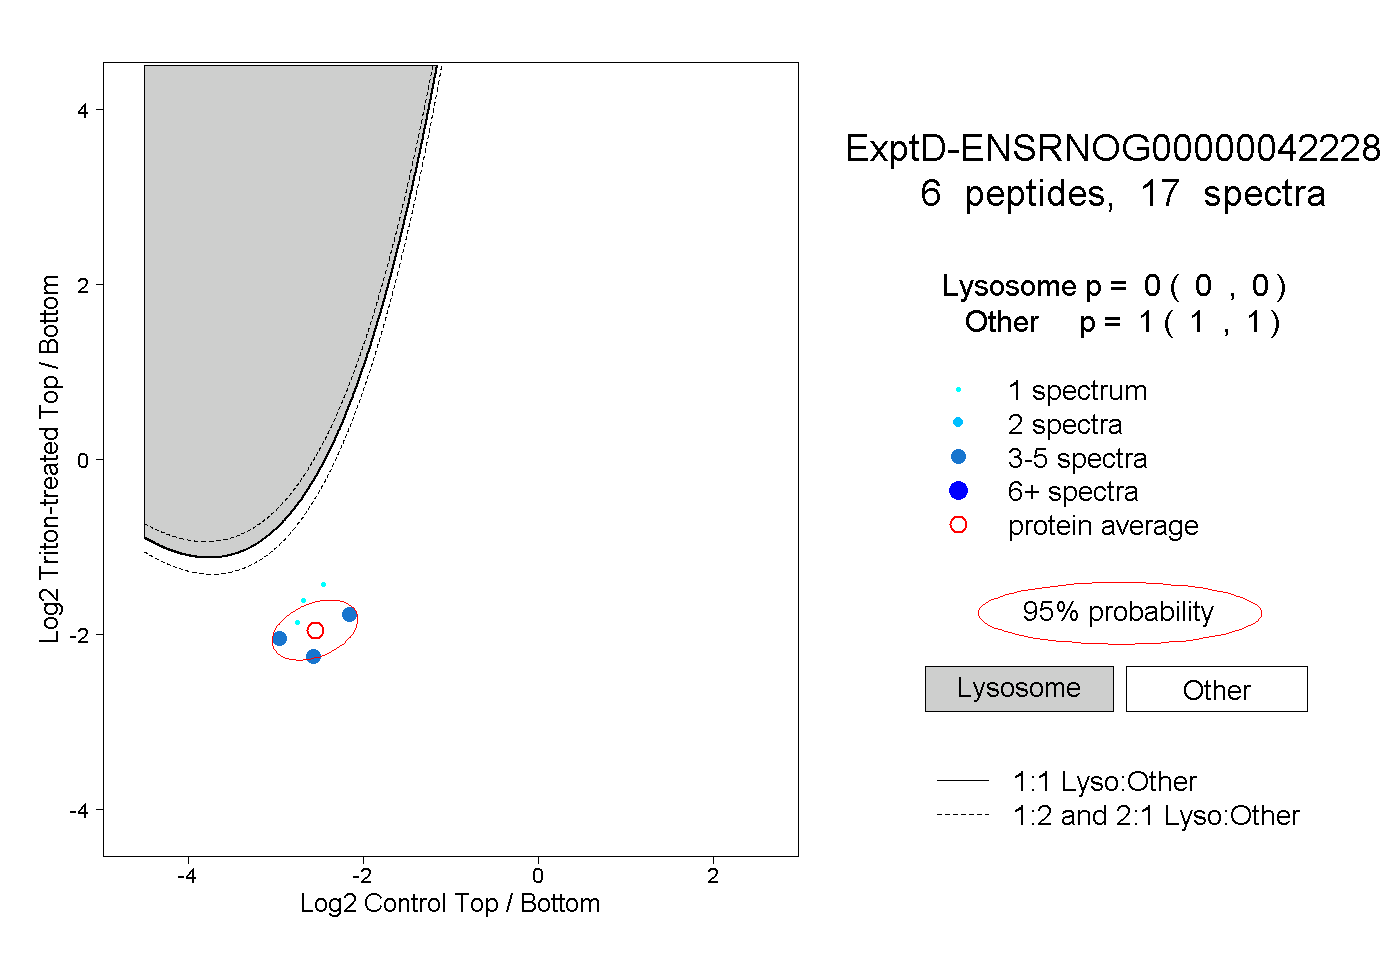 |
0.000 0.000 | 0.000 |
1.000 1.000 | 1.000 |