 1
1peptide
spectra
0.000 | 0.000
0.000 | 0.000
0.000 | 0.000
0.434 | 0.482
0.062 | 0.117
0.000 | 0.000
0.285 | 0.341
0.118 | 0.146
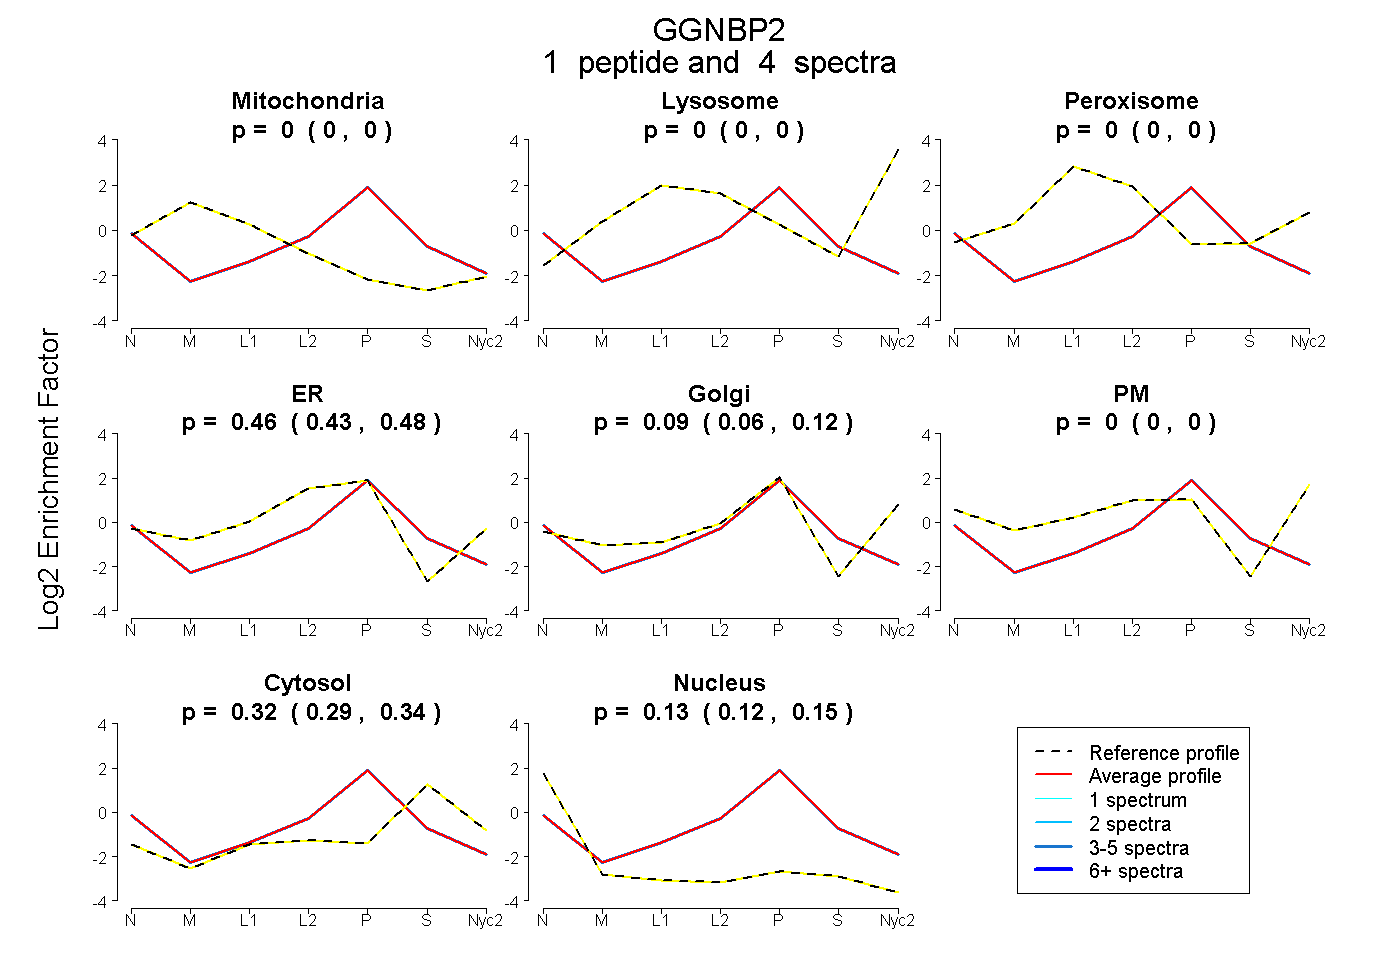
| Plot | Mito | Lyso | Perox | ER | Golgi | PM | Cytosol | Nucleus | |||||
| Expt A |
1 peptide |
4 spectra |
|
0.000 0.000 | 0.000 |
0.000 0.000 | 0.000 |
0.000 0.000 | 0.000 |
0.462 0.434 | 0.482 |
0.089 0.062 | 0.117 |
0.000 0.000 | 0.000 |
0.316 0.285 | 0.341 |
0.133 0.118 | 0.146 |