 64
64peptides
spectra
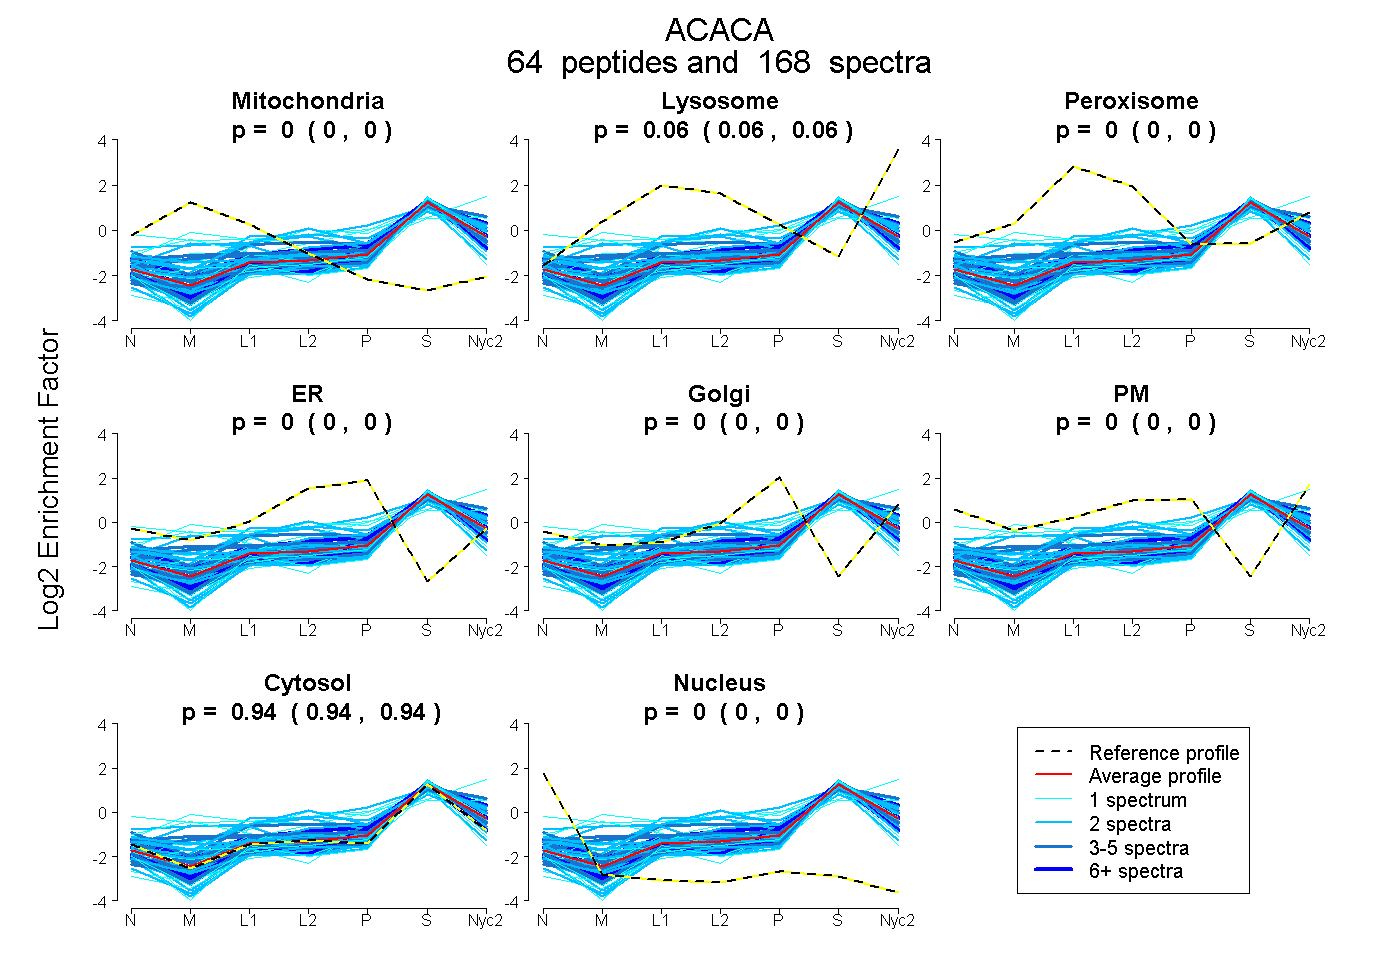
0.000 | 0.000
0.058 | 0.061
0.000 | 0.000
0.000 | 0.000
0.000 | 0.001
0.000 | 0.000
0.939 | 0.941
0.000 | 0.000
29peptides
spectra
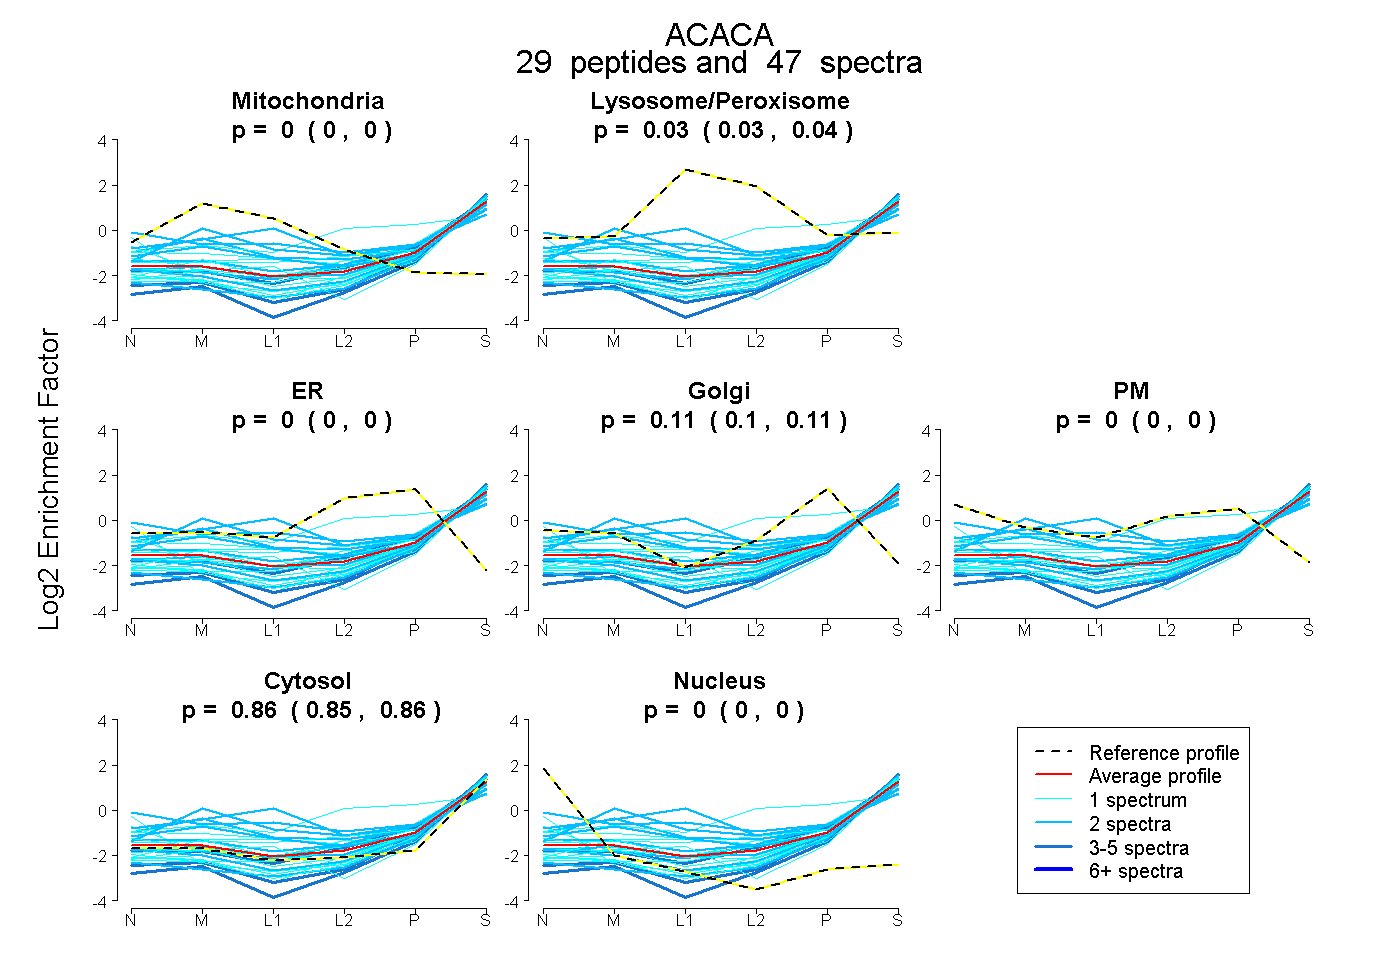
0.000 | 0.000
0.027 | 0.042
0.000 | 0.000
0.103 | 0.114
0.000 | 0.000
0.851 | 0.861
0.000 | 0.000
54peptides
spectra
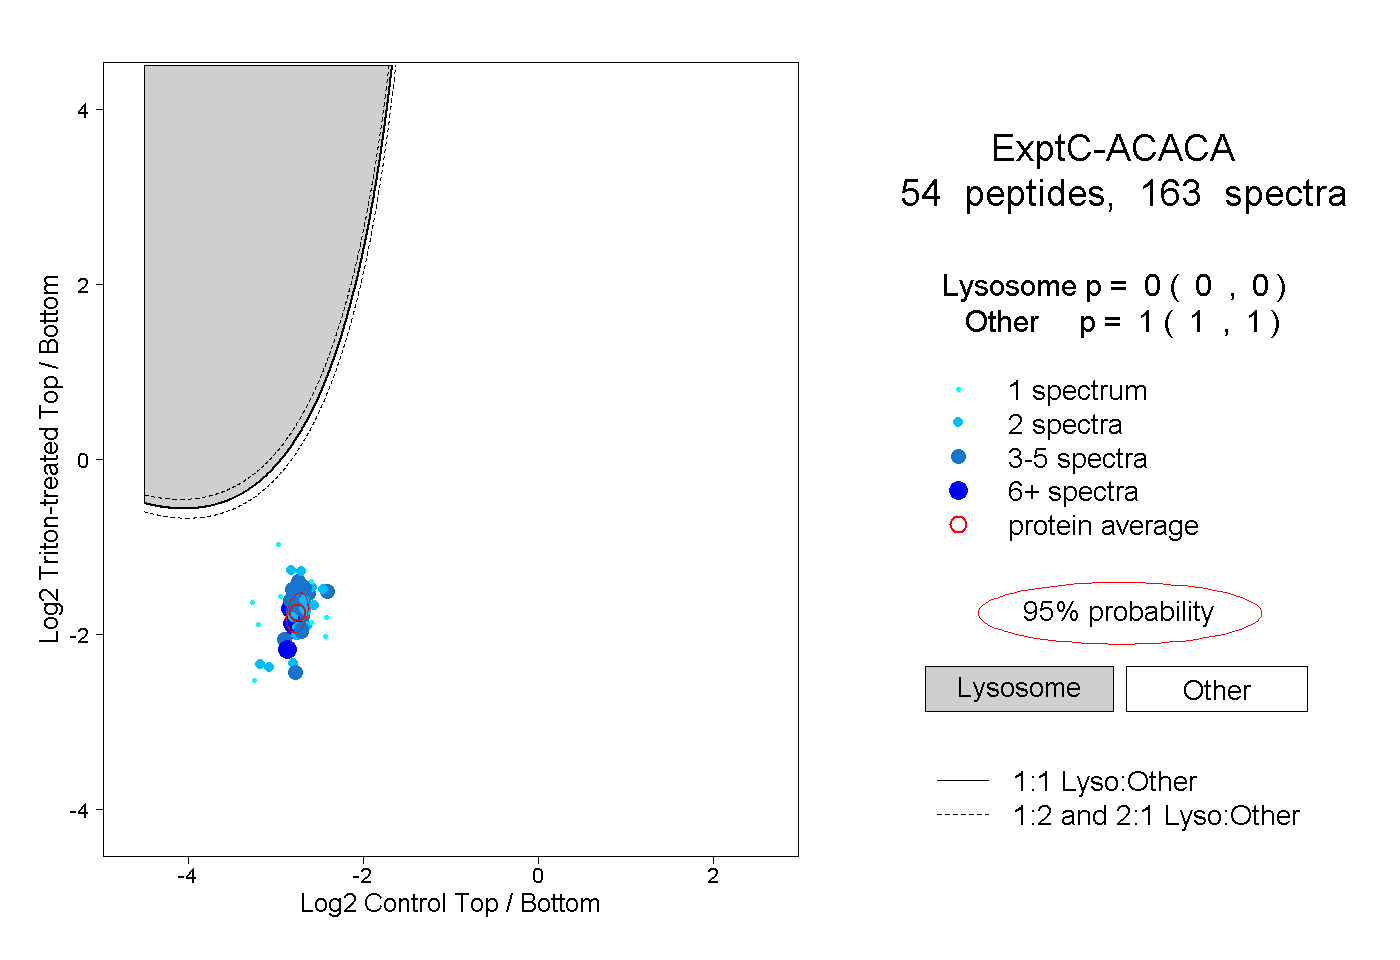
0.000 | 0.000
1.000 | 1.000
12peptides
spectra
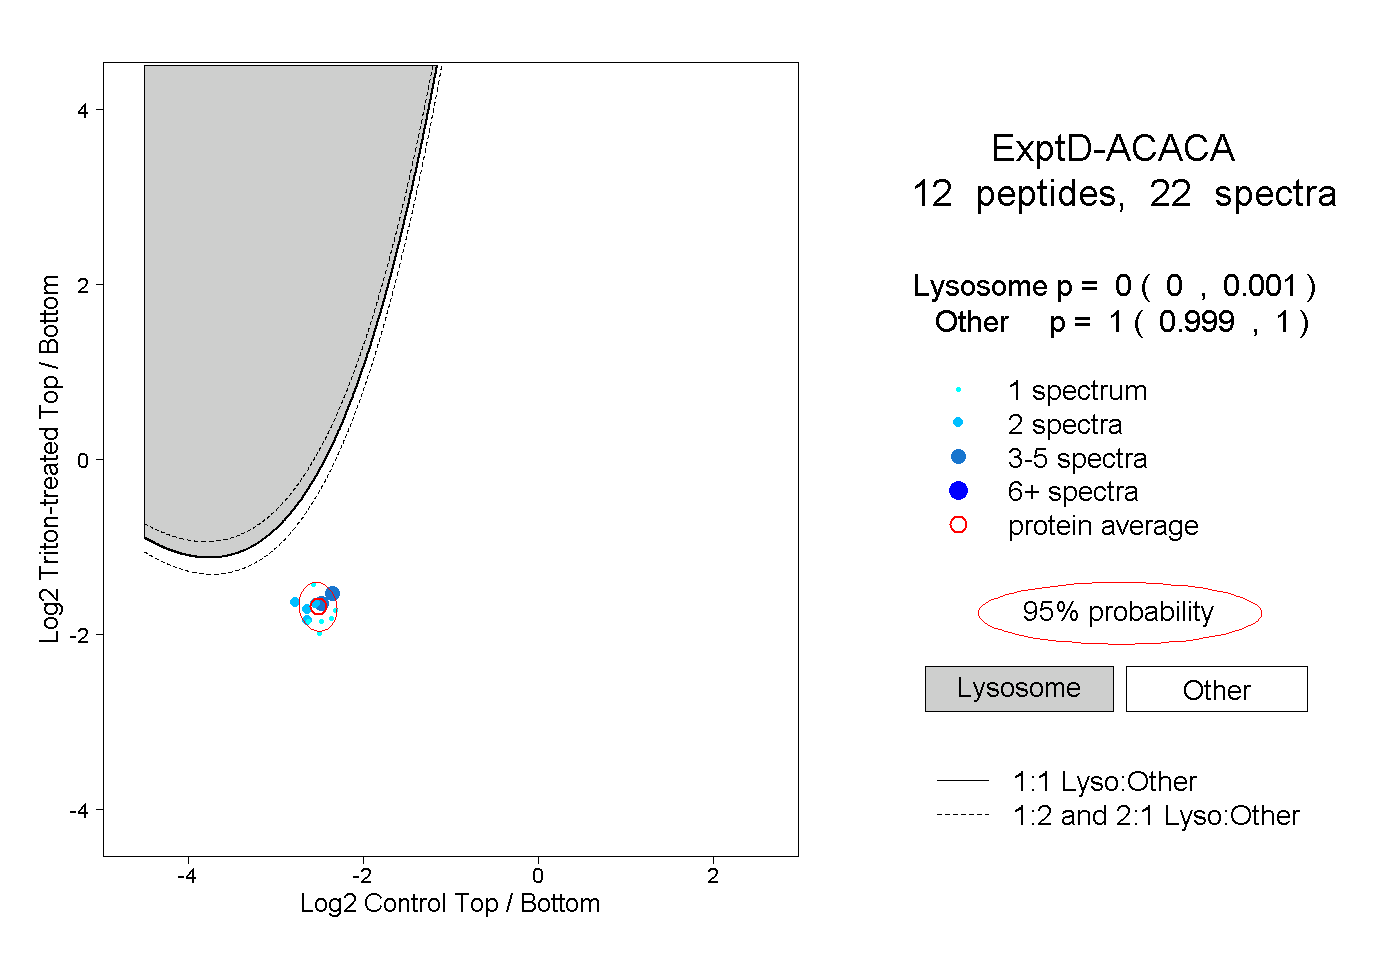
0.000 | 0.001
0.999 | 1.000