 17
17peptides
spectra
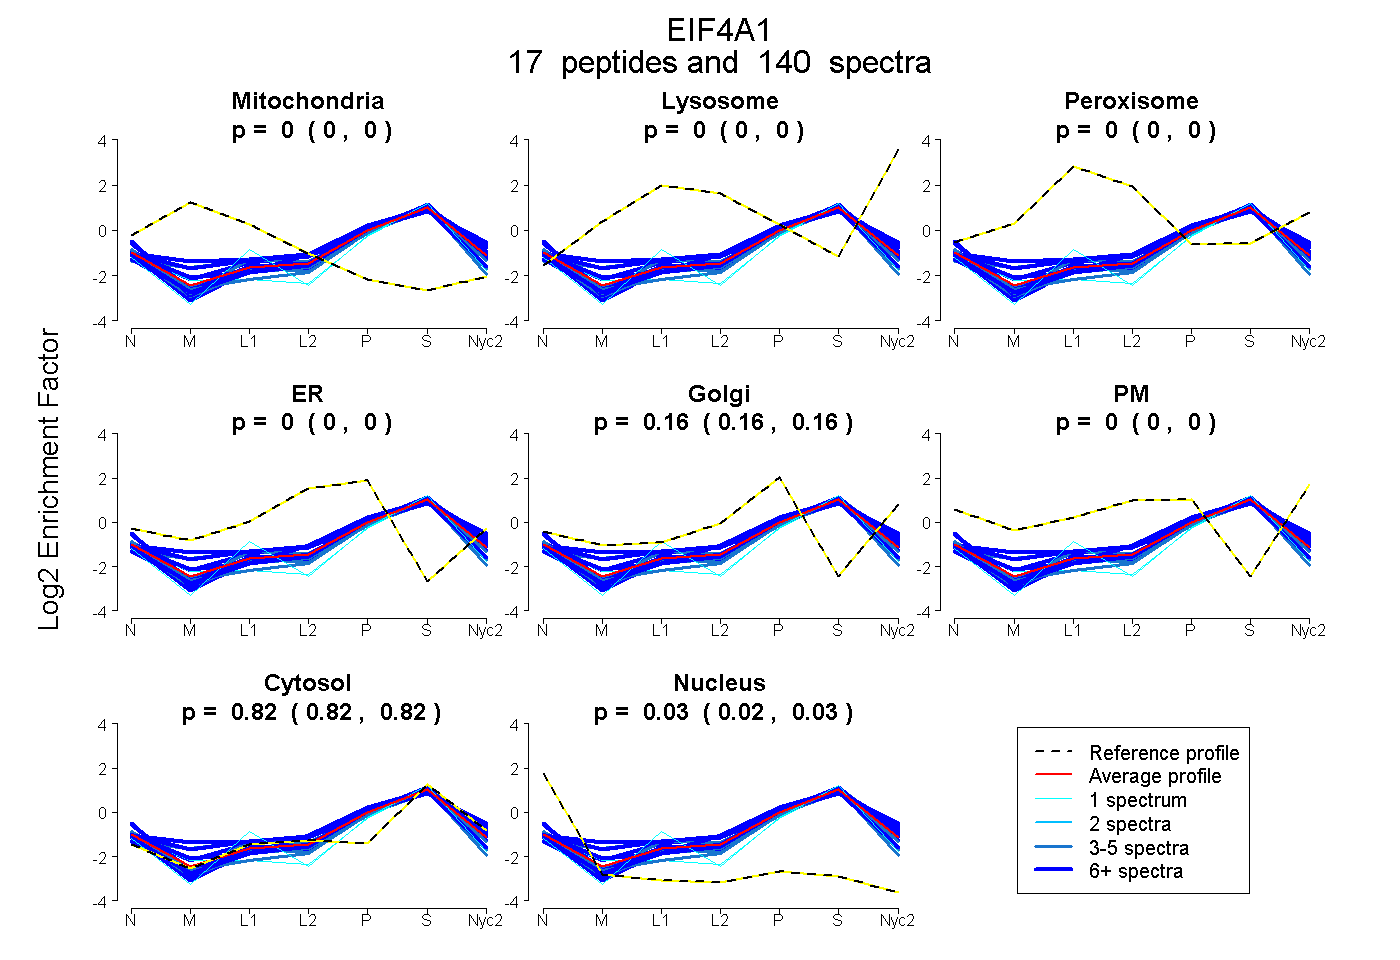
0.000 | 0.000
0.000 | 0.000
0.000 | 0.000
0.000 | 0.000
0.155 | 0.158
0.000 | 0.000
0.816 | 0.818
0.024 | 0.027
13peptides
spectra
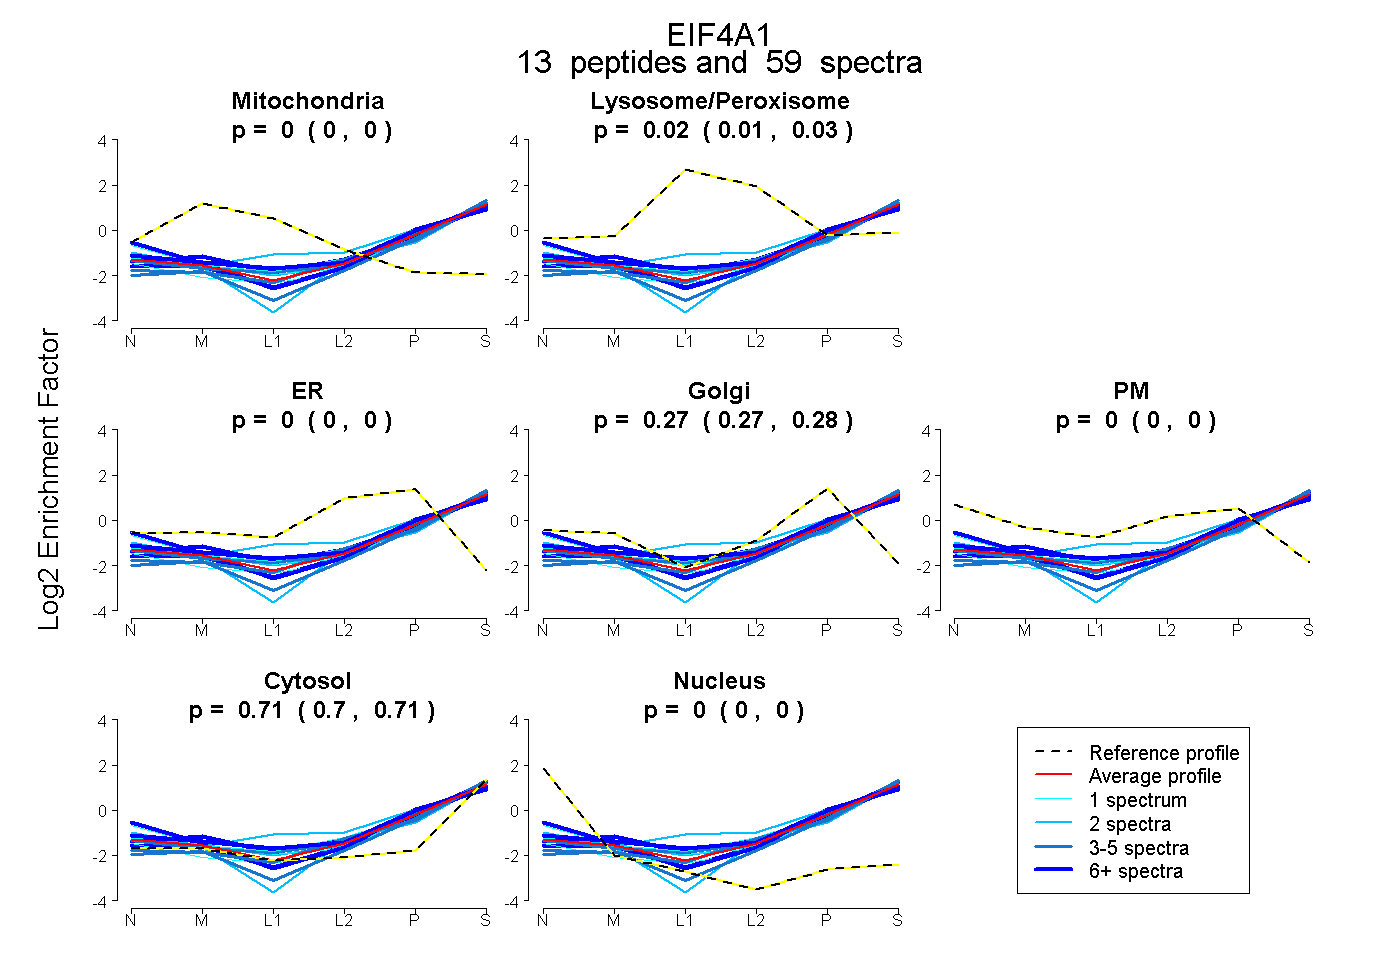
0.000 | 0.000
0.015 | 0.026
0.000 | 0.000
0.267 | 0.276
0.000 | 0.000
0.704 | 0.710
0.000 | 0.000
15peptides
spectra
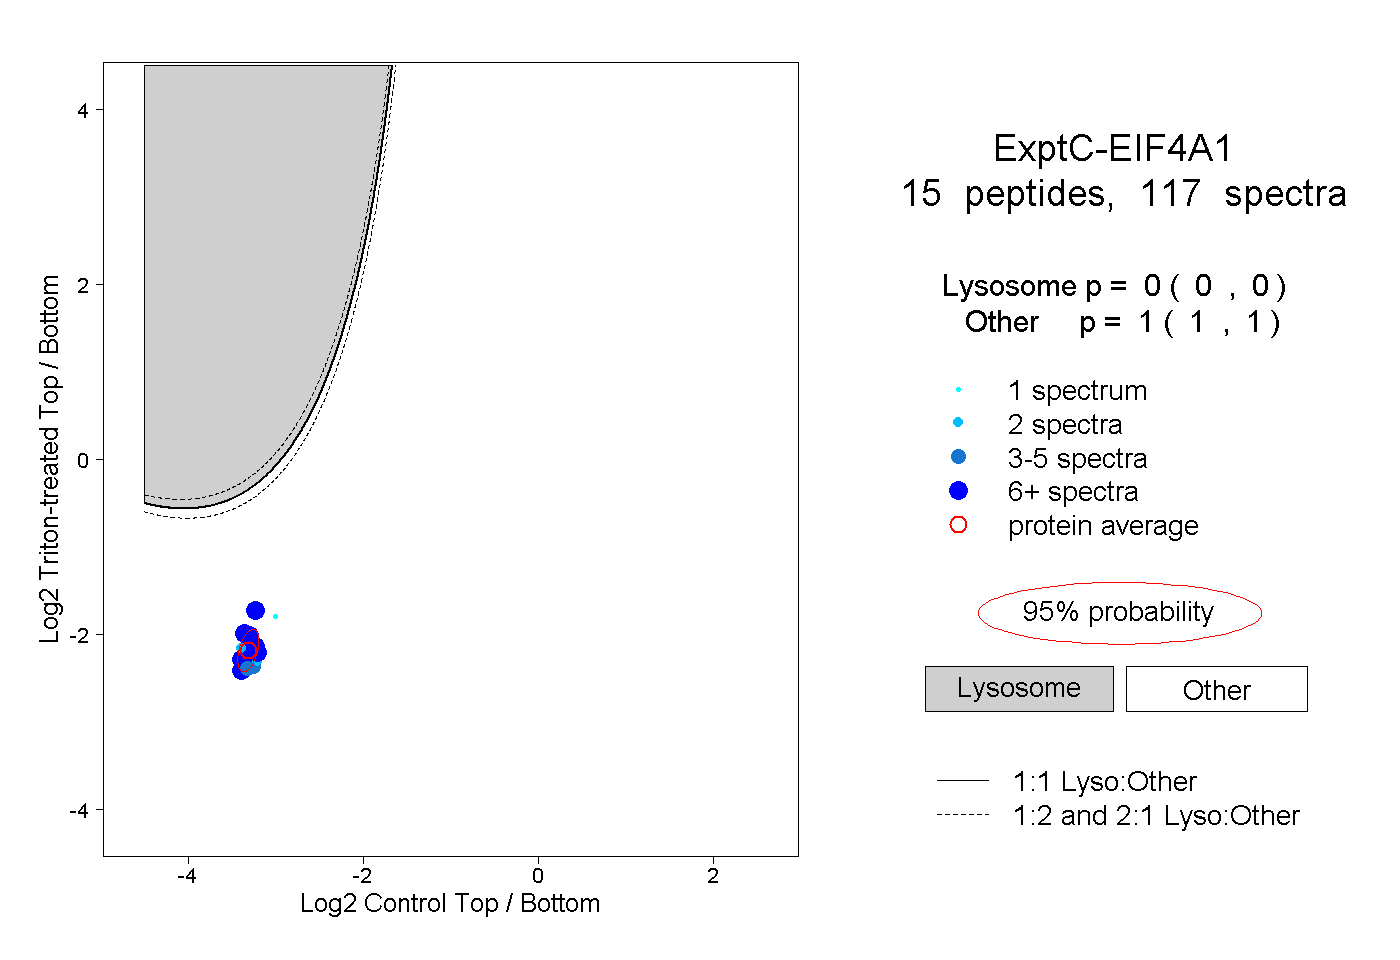
0.000 | 0.000
1.000 | 1.000
7peptides
spectra
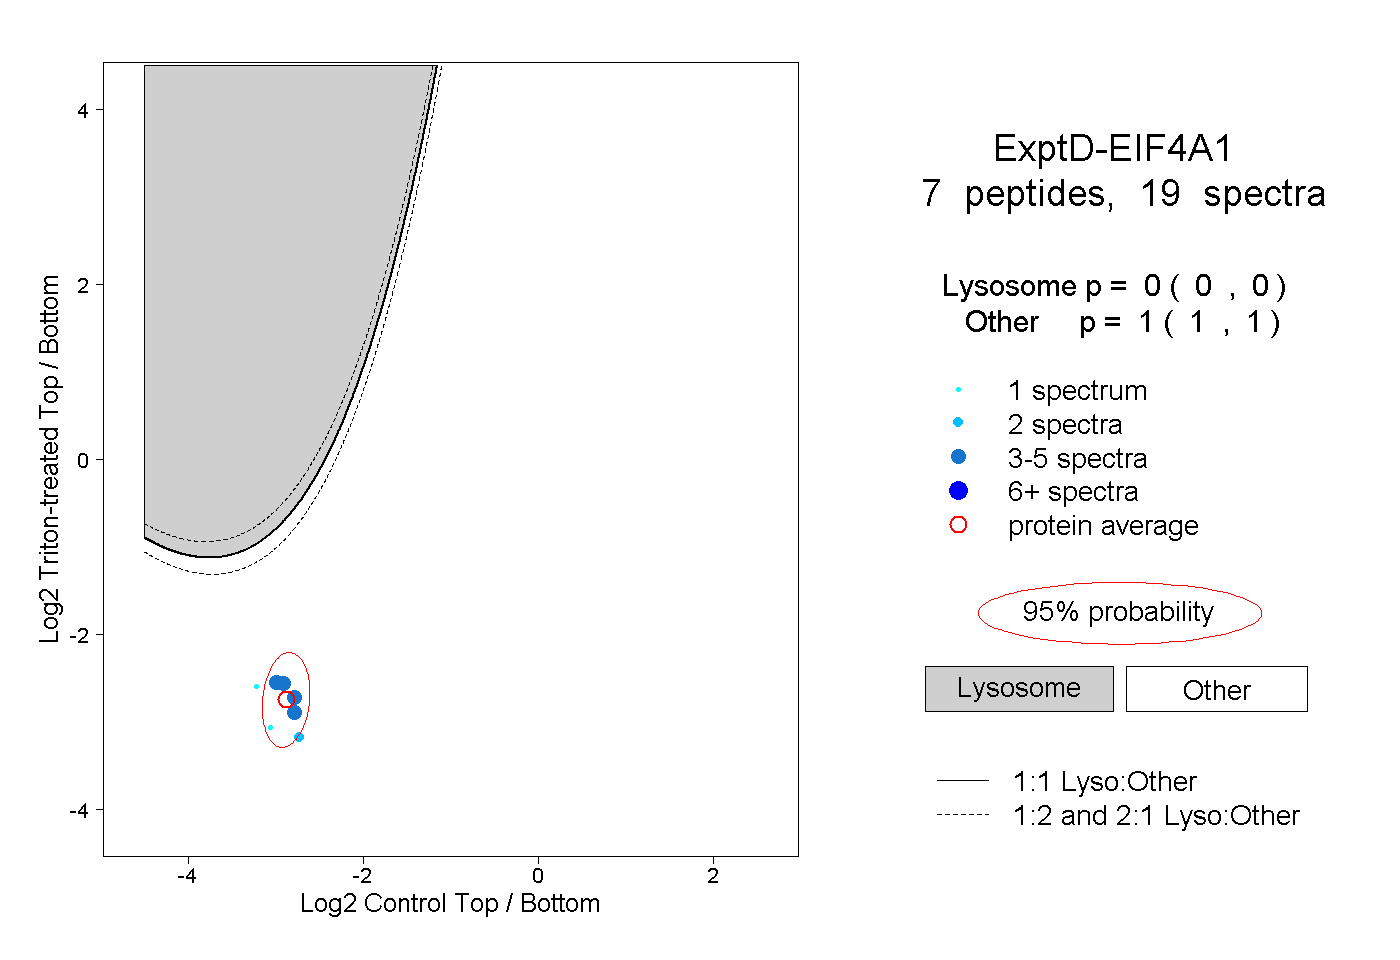
0.000 | 0.000
1.000 | 1.000