 4
4peptides
spectra
0.000 | 0.000
0.000 | 0.000
0.000 | 0.000
0.092 | 0.119
0.000 | 0.000
0.000 | 0.000
0.550 | 0.587
0.302 | 0.342
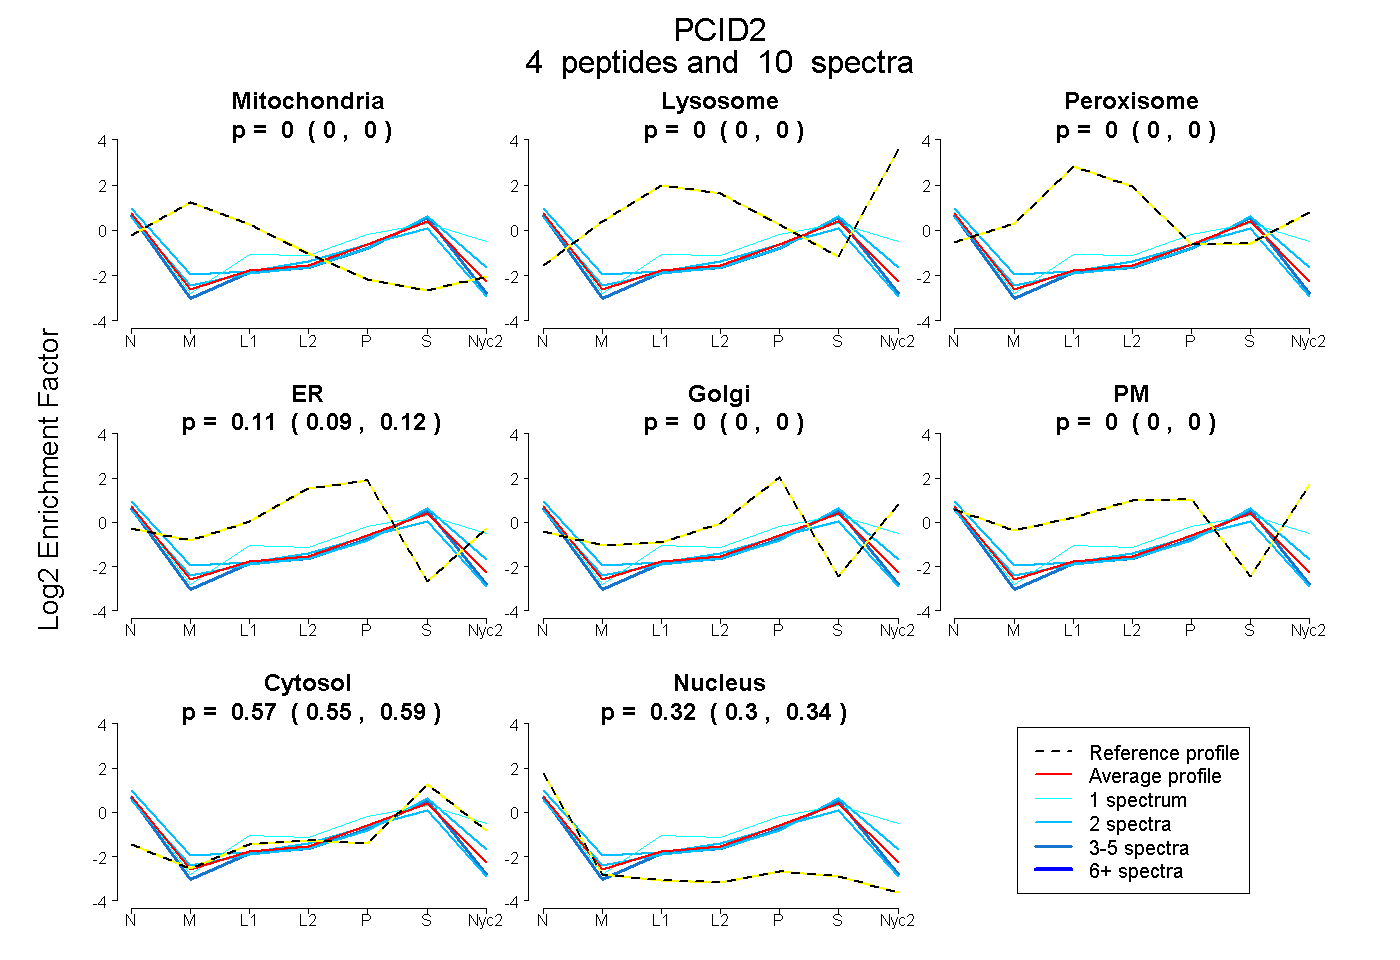
| Plot | Mito | Lyso | Perox | ER | Golgi | PM | Cytosol | Nucleus | |||||
| Expt A |
4 peptides |
10 spectra |
|
0.000 0.000 | 0.000 |
0.000 0.000 | 0.000 |
0.000 0.000 | 0.000 |
0.106 0.092 | 0.119 |
0.000 0.000 | 0.000 |
0.000 0.000 | 0.000 |
0.570 0.550 | 0.587 |
0.324 0.302 | 0.342 |
| 1 spectrum, DGASCAELVSFK | 0.000 | 0.000 | 0.000 | 0.000 | 0.005 | 0.270 | 0.575 | 0.151 | ||
| 2 spectra, CQTVIVQSFLR | 0.000 | 0.000 | 0.000 | 0.159 | 0.000 | 0.000 | 0.442 | 0.398 | ||
| 2 spectra, DDYSTAQR | 0.000 | 0.000 | 0.000 | 0.007 | 0.049 | 0.030 | 0.647 | 0.268 | ||
| 5 spectra, AAELLMSCFR | 0.000 | 0.000 | 0.000 | 0.032 | 0.000 | 0.000 | 0.605 | 0.363 |