15
15peptides
spectra
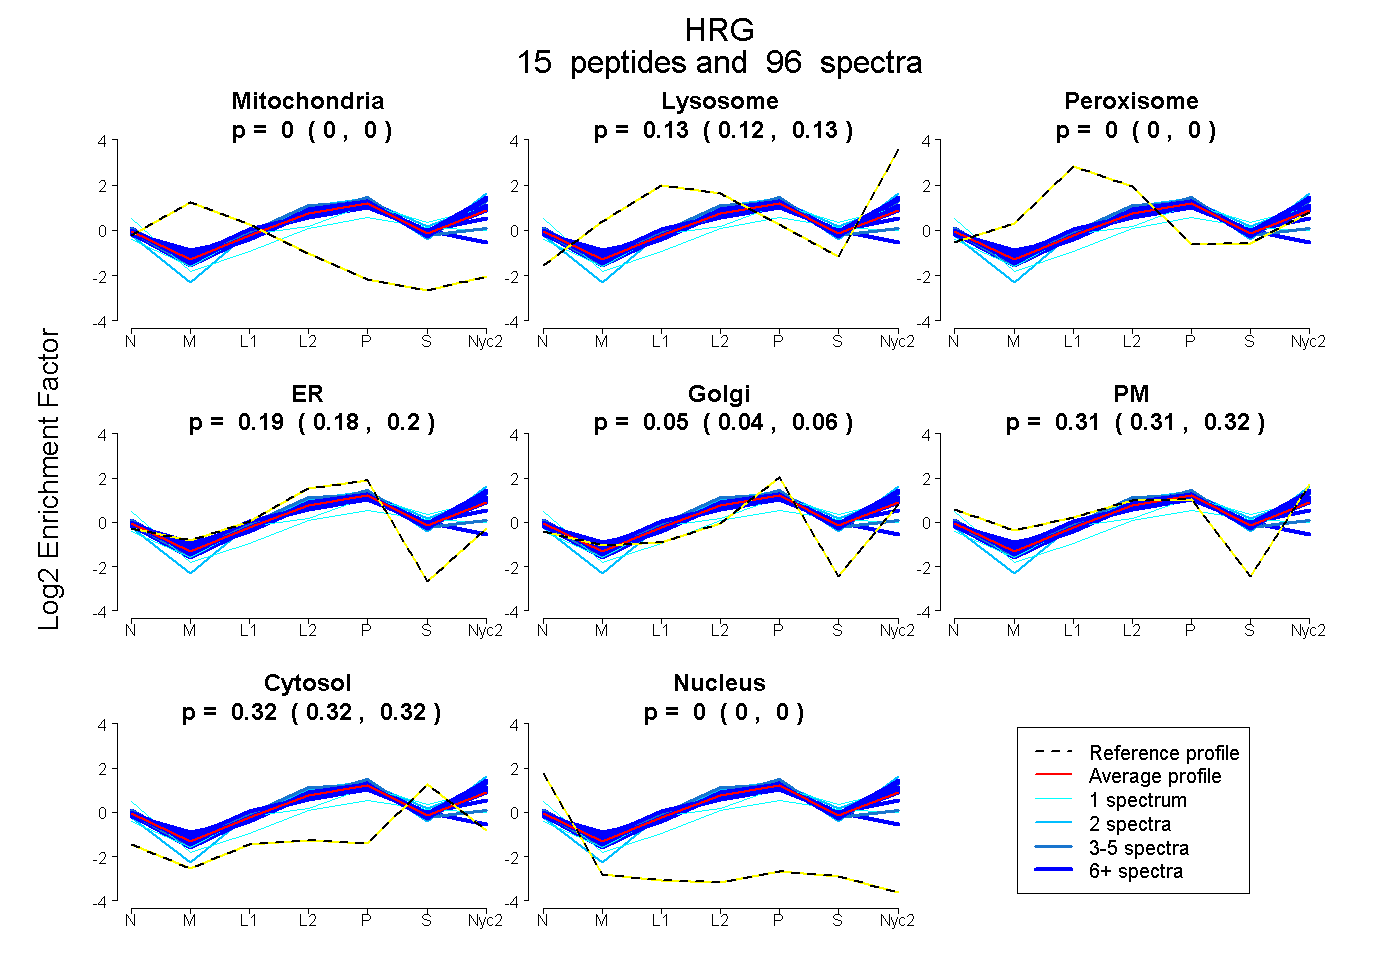
0.000 | 0.000
0.122 | 0.129
0.000 | 0.000
0.178 | 0.199
0.045 | 0.060
0.306 | 0.316
0.317 | 0.322
0.000 | 0.000
11peptides
spectra
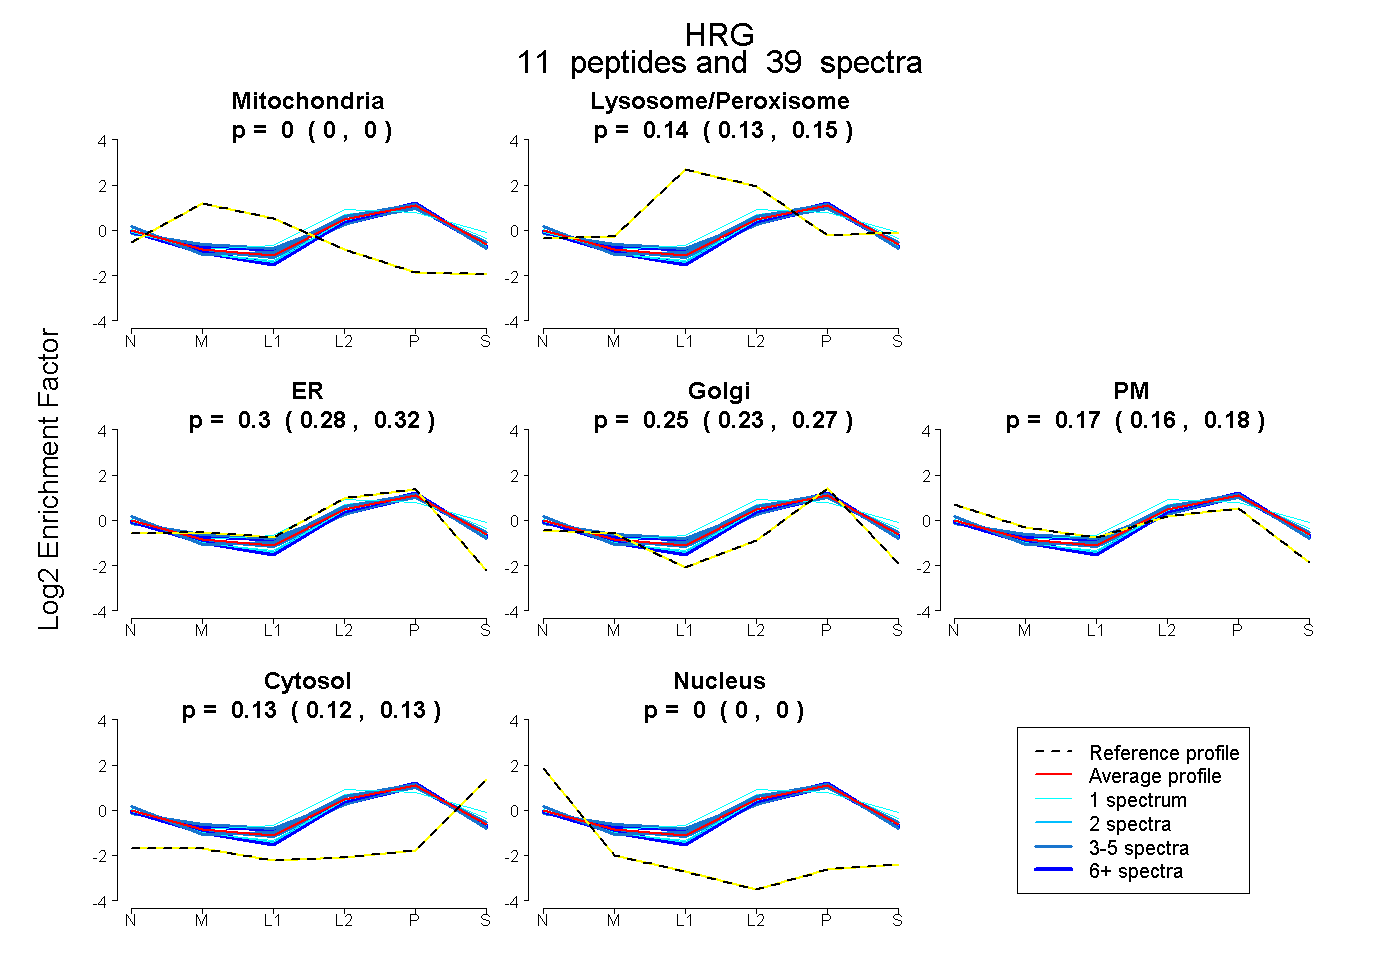
0.000 | 0.000
0.131 | 0.151
0.284 | 0.320
0.232 | 0.271
0.162 | 0.180
0.124 | 0.134
0.000 | 0.000