 1
1peptide
spectra
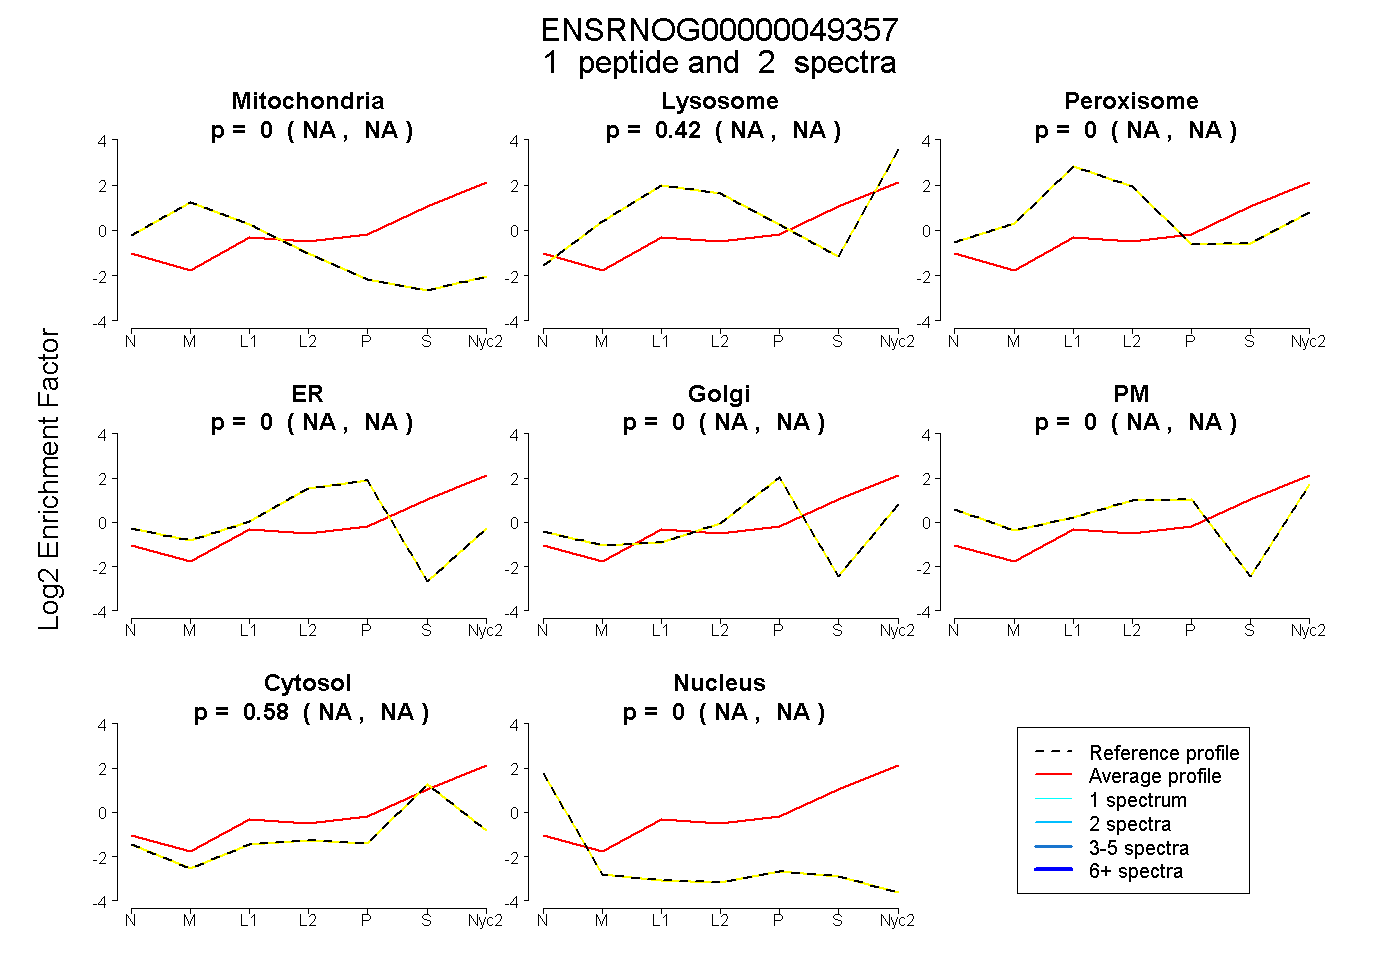
NA | NA
NA | NA
NA | NA
NA | NA
NA | NA
NA | NA
NA | NA
NA | NA
1peptide
spectra
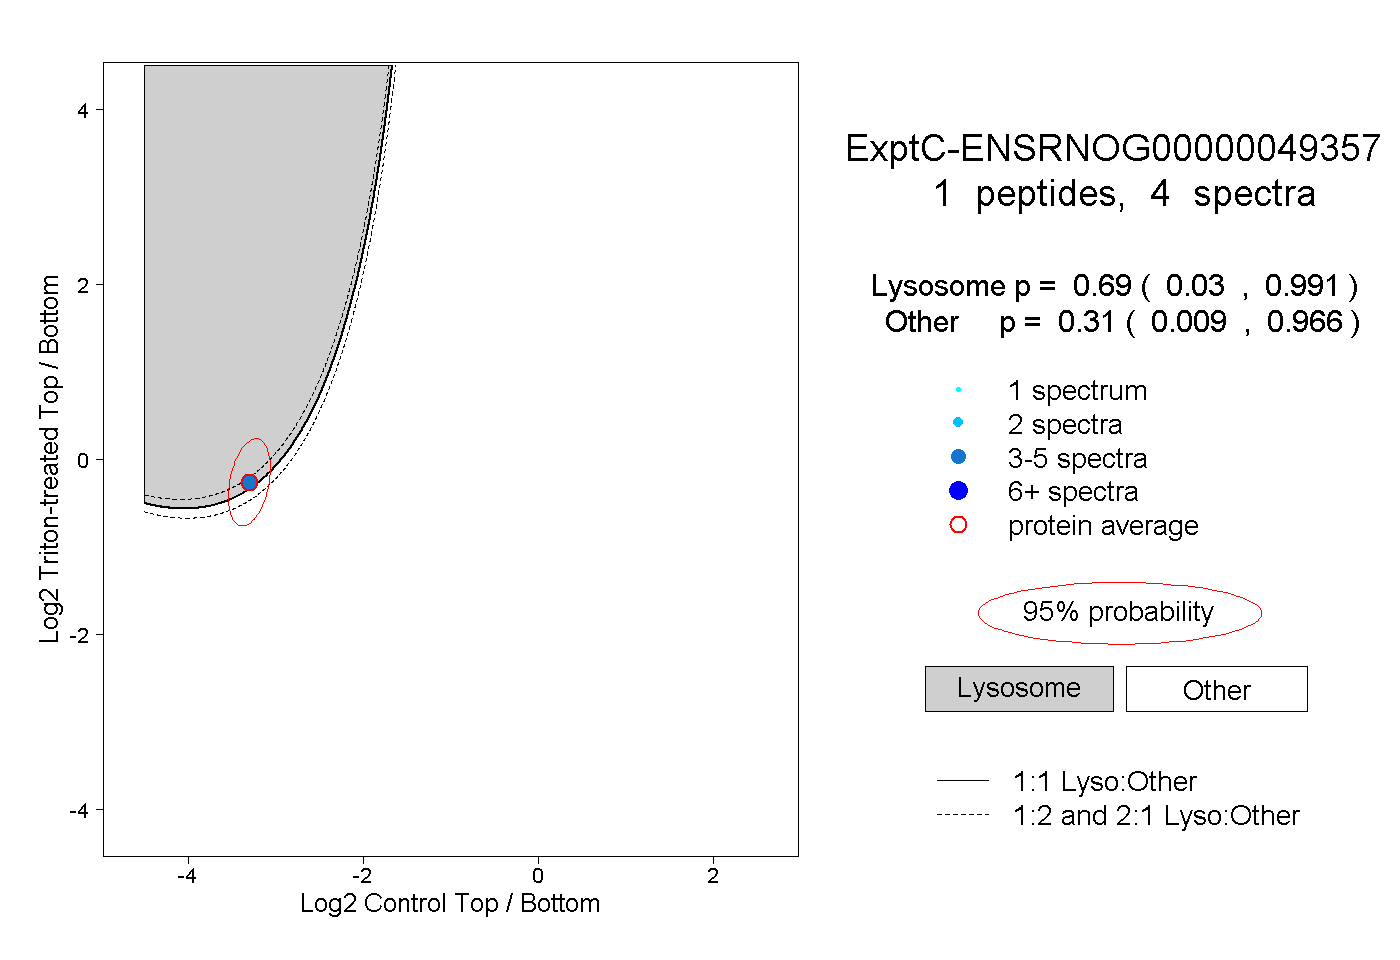
0.030 | 0.991
0.009 | 0.966
| Plot | Mito | Lyso | Perox | ER | Golgi | PM | Cytosol | Nucleus | |||||
| Expt A |
1 peptide |
2 spectra |
|
0.000 NA | NA |
0.421 NA | NA |
0.000 NA | NA |
0.000 NA | NA |
0.000 NA | NA |
0.000 NA | NA |
0.579 NA | NA |
0.000 NA | NA |
||
| Plot | Lyso | Other | |||||||||||
| Expt C |
1 peptide |
4 spectra |
|
0.690 0.030 | 0.991 |
0.310 0.009 | 0.966 |