RABGGTA
[ENSRNOP00000049261]
Main page
| | | Plot |
Mito |
Lyso |
|
Perox |
ER |
Golgi |
PM |
Cytosol |
Nucleus |
|
| Expt A |
 20
20
peptides |
47
spectra |
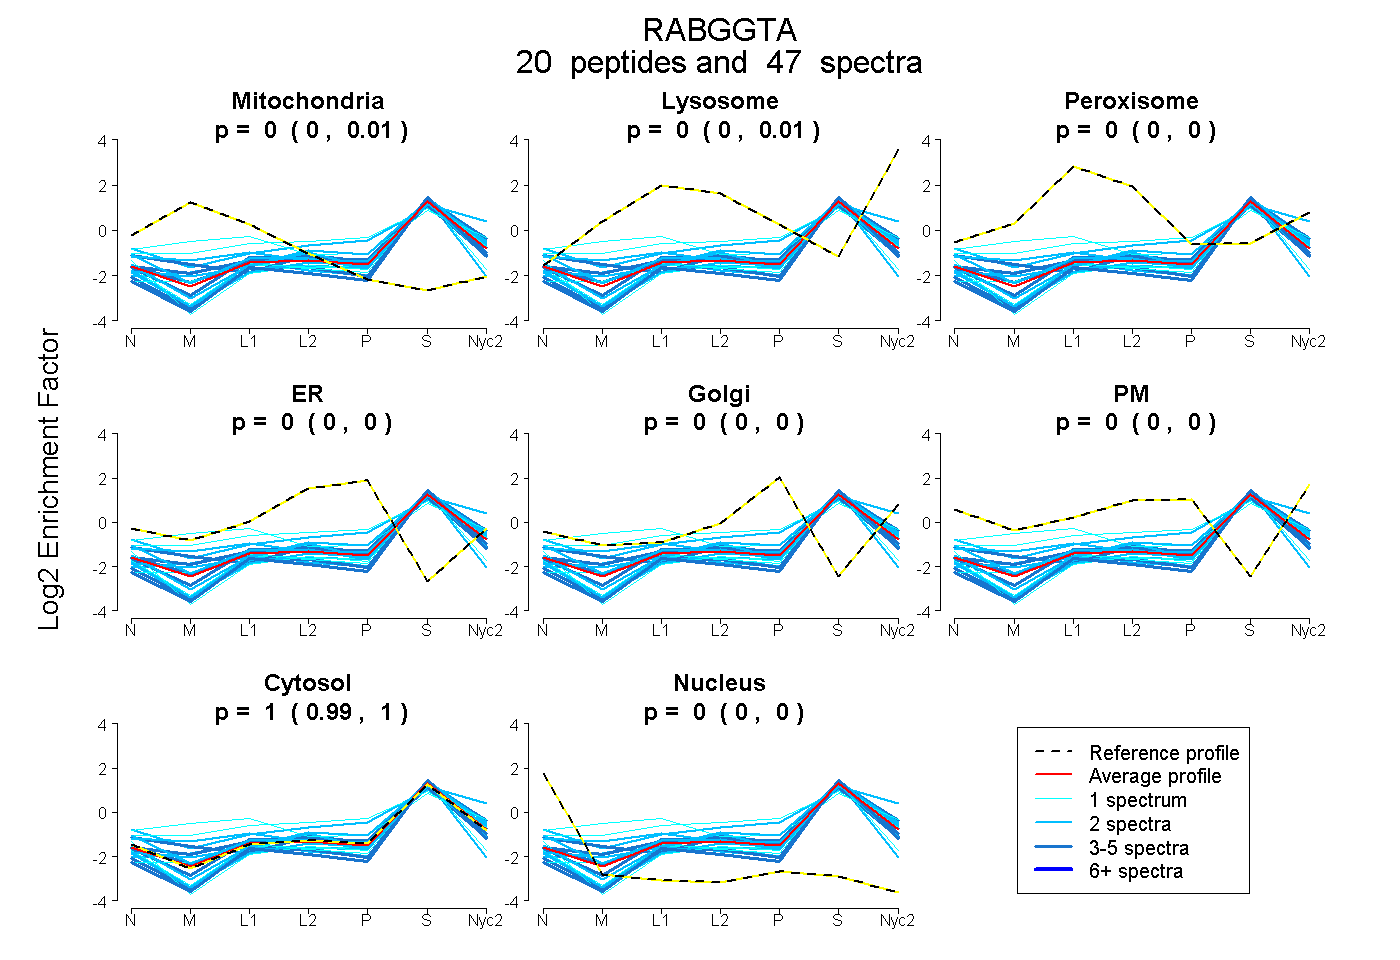 |
0.002
0.000 | 0.007 |
0.002
0.000 | 0.005 |
|
0.000
0.000 | 0.000 |
0.000
0.000 | 0.000 |
0.000
0.000 | 0.000 |
0.000
0.000 | 0.000 |
0.997
0.989 | 1.000 |
0.000
0.000 | 0.000 |
|
| | | Plot |
Mito |
|
Lyso or Perox |
|
ER |
Golgi |
PM |
Cytosol |
Nucleus |
|
| Expt B |
8
peptides |
13
spectra |
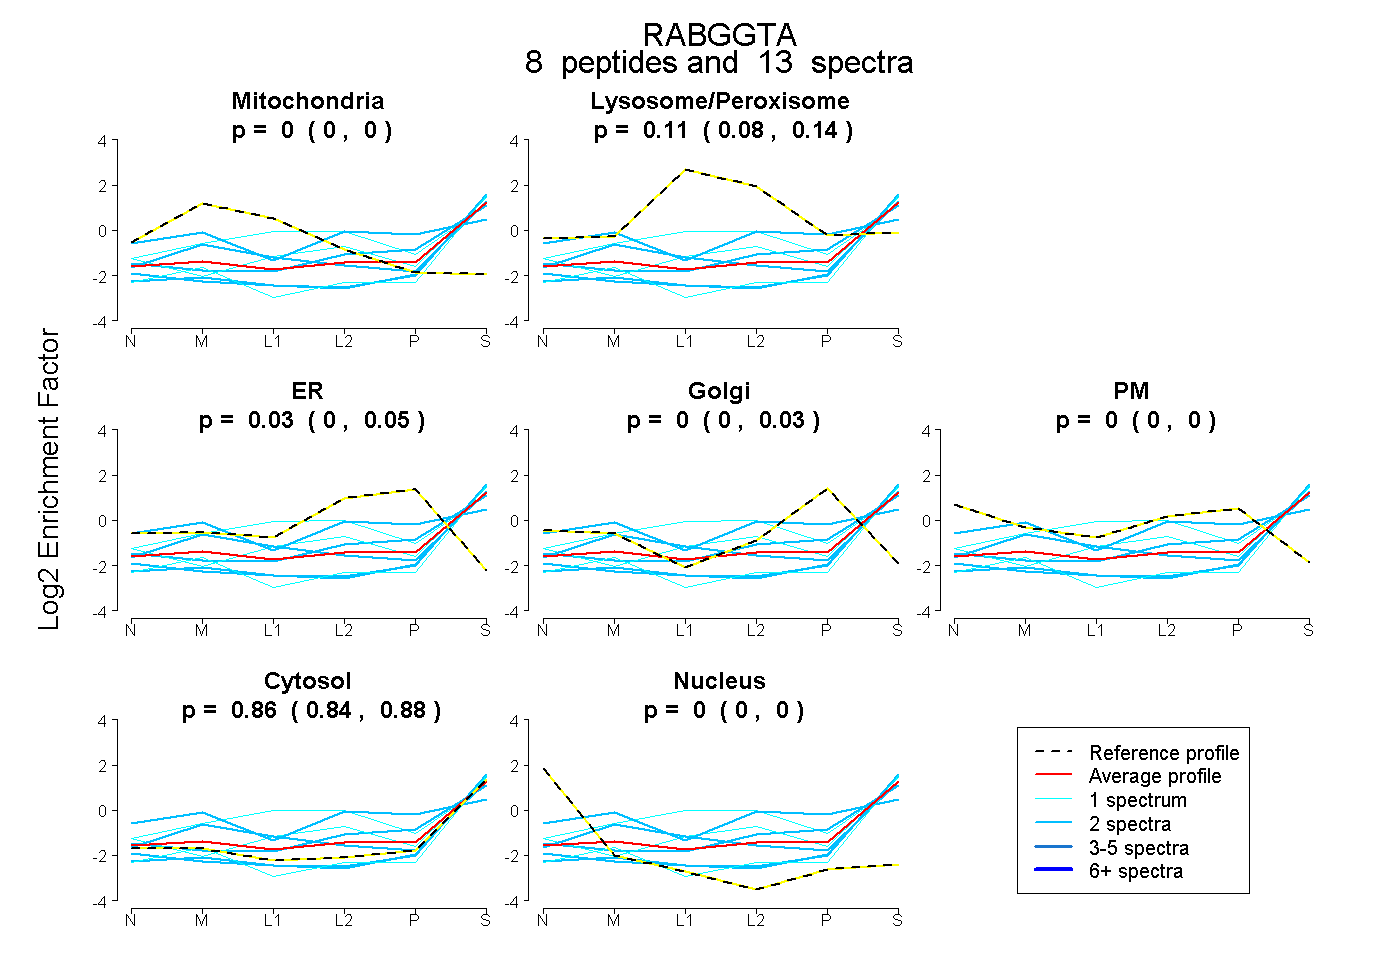 |
0.000
0.000 | 0.001 |
|
0.110
0.081 | 0.137 |
|
0.029
0.000 | 0.054 |
0.000
0.000 | 0.029 |
0.000
0.000 | 0.000 |
0.861
0.835 | 0.880 |
0.000
0.000 | 0.000 |
|
| | | Plot |
|
Lyso |
|
|
|
|
|
|
|
Other |
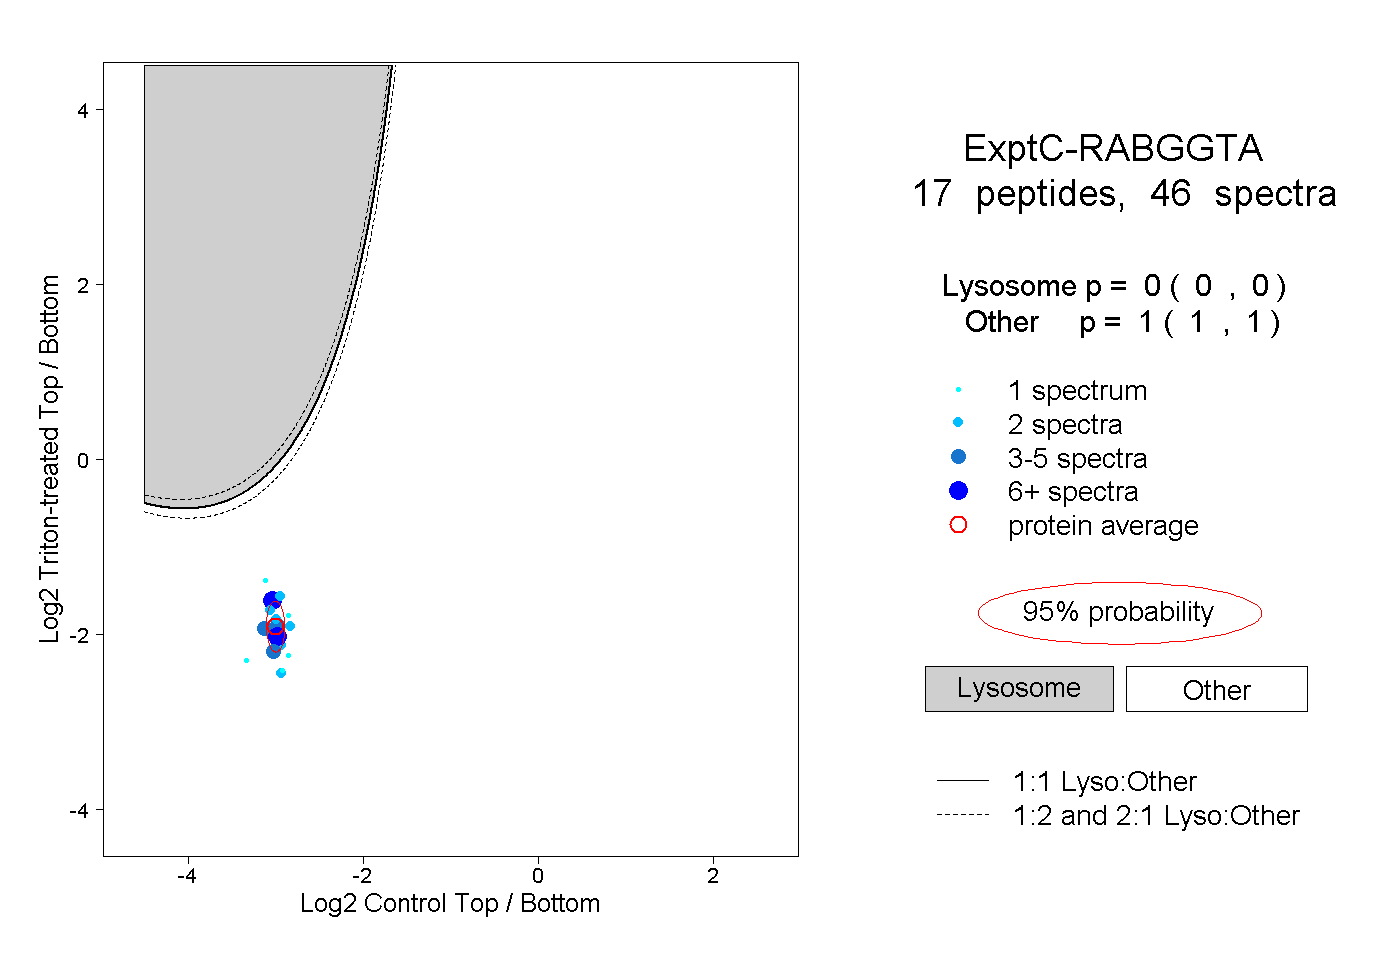
| Expt C |
17
peptides |
46
spectra |
 |
|
0.000
0.000 | 0.000 |
|
|
|
|
|
|
|
1.000
1.000 | 1.000 |
| 4 spectra, TSEEQAEAK |
|
0.000 |
|
|
|
|
|
|
|
1.000 |
| 1 spectrum, LPENVLLK |
|
0.000 |
|
|
|
|
|
|
|
1.000 |
| 2 spectra, VIWTGSDSQK |
|
0.000 |
|
|
|
|
|
|
|
1.000 |
| 2 spectra, DSATDEQLFR |
|
0.000 |
|
|
|
|
|
|
|
1.000 |
| 1 spectrum, EVLQHLETEK |
|
0.000 |
|
|
|
|
|
|
|
1.000 |
| 1 spectrum, ELQELEPENK |
|
0.000 |
|
|
|
|
|
|
|
1.000 |
| 2 spectra, FLLENSVLK |
|
0.000 |
|
|
|
|
|
|
|
1.000 |
| 4 spectra, AAYLDDLR |
|
0.000 |
|
|
|
|
|
|
|
1.000 |
| 1 spectrum, MEYADVR |
|
0.000 |
|
|
|
|
|
|
|
1.000 |
| 2 spectra, LPEPNWAR |
|
0.000 |
|
|
|
|
|
|
|
1.000 |
| 2 spectra, LQELLLCNNR |
|
0.000 |
|
|
|
|
|
|
|
1.000 |
| 3 spectra, ALPPALAALR |
|
0.000 |
|
|
|
|
|
|
|
1.000 |
| 2 spectra, AELGFLESCLR |
|
0.000 |
|
|
|
|
|
|
|
1.000 |
| 1 spectrum, LYQSATQAVFQK |
|
0.000 |
|
|
|
|
|
|
|
1.000 |
| 6 spectra, ELELCAR |
|
0.000 |
|
|
|
|
|
|
|
1.000 |
| 2 spectra, DRPECWCR |
|
0.000 |
|
|
|
|
|
|
|
1.000 |
| 10 spectra, FLEADER |
|
0.000 |
|
|
|
|
|
|
|
1.000 |
| | | Plot |
|
Lyso |
|
|
|
|
|
|
|
Other |
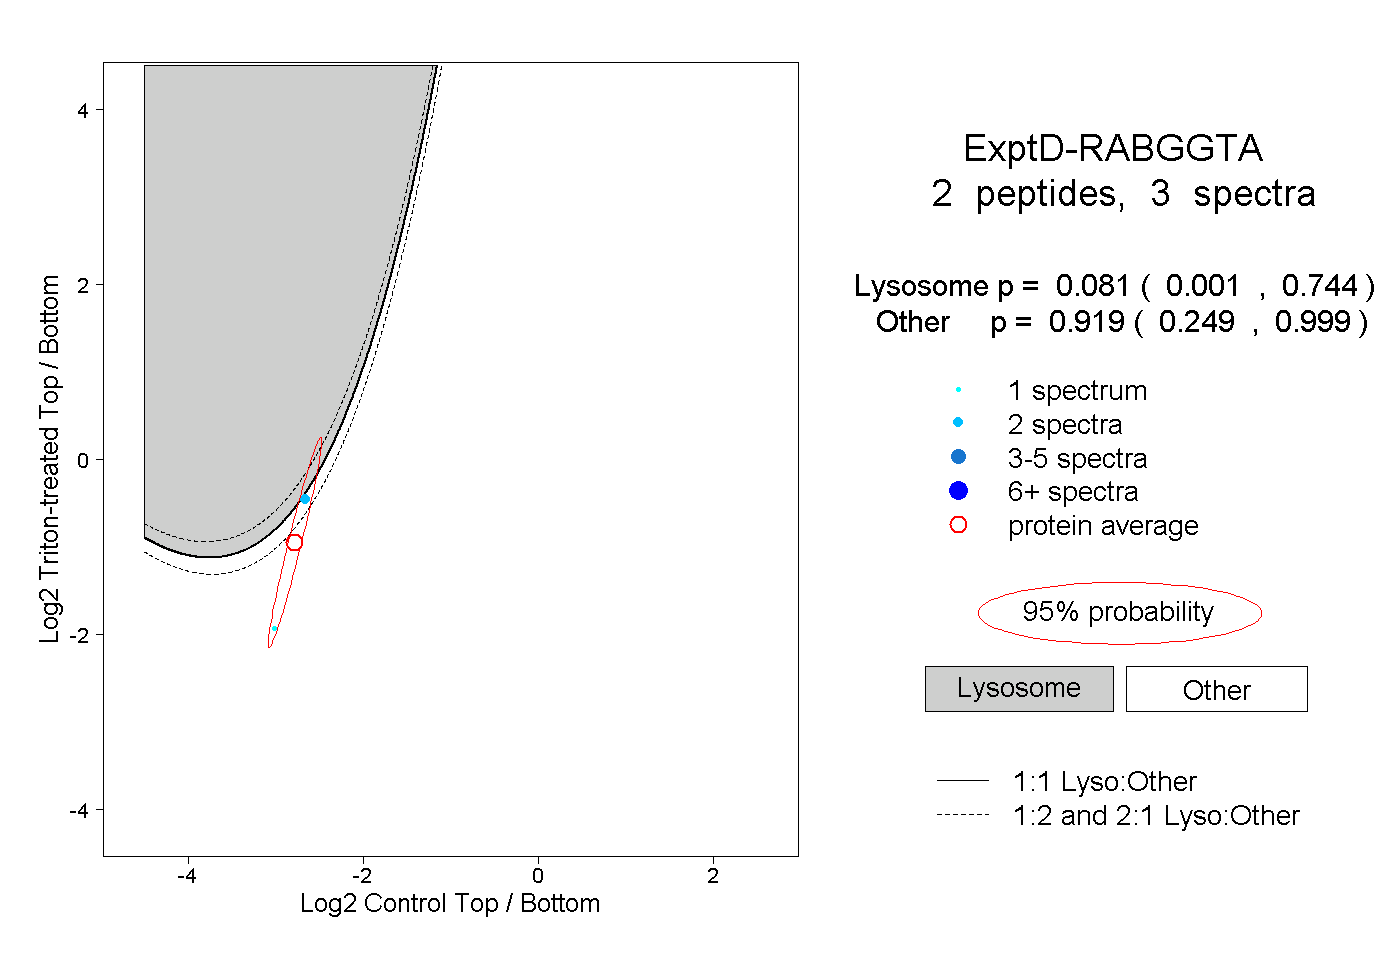
| Expt D |
2
peptides |
3
spectra |
 |
|
0.081
0.001 | 0.744 |
|
|
|
|
|
|
|
0.919
0.249 | 0.999 |