20
20peptides
spectra
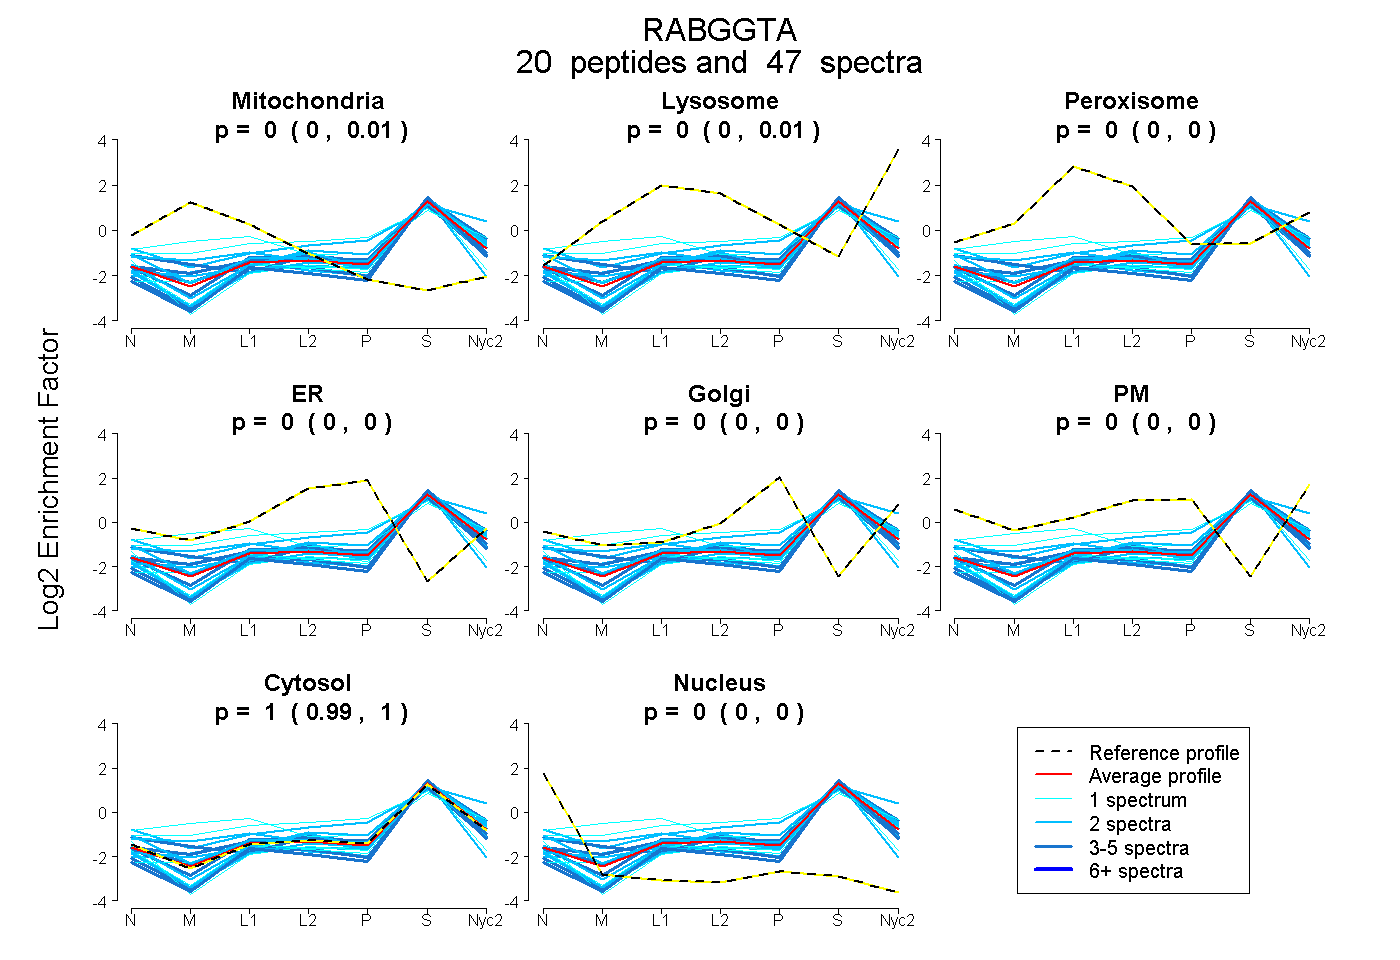
0.000 | 0.007
0.000 | 0.005
0.000 | 0.000
0.000 | 0.000
0.000 | 0.000
0.000 | 0.000
0.989 | 1.000
0.000 | 0.000
8peptides
spectra
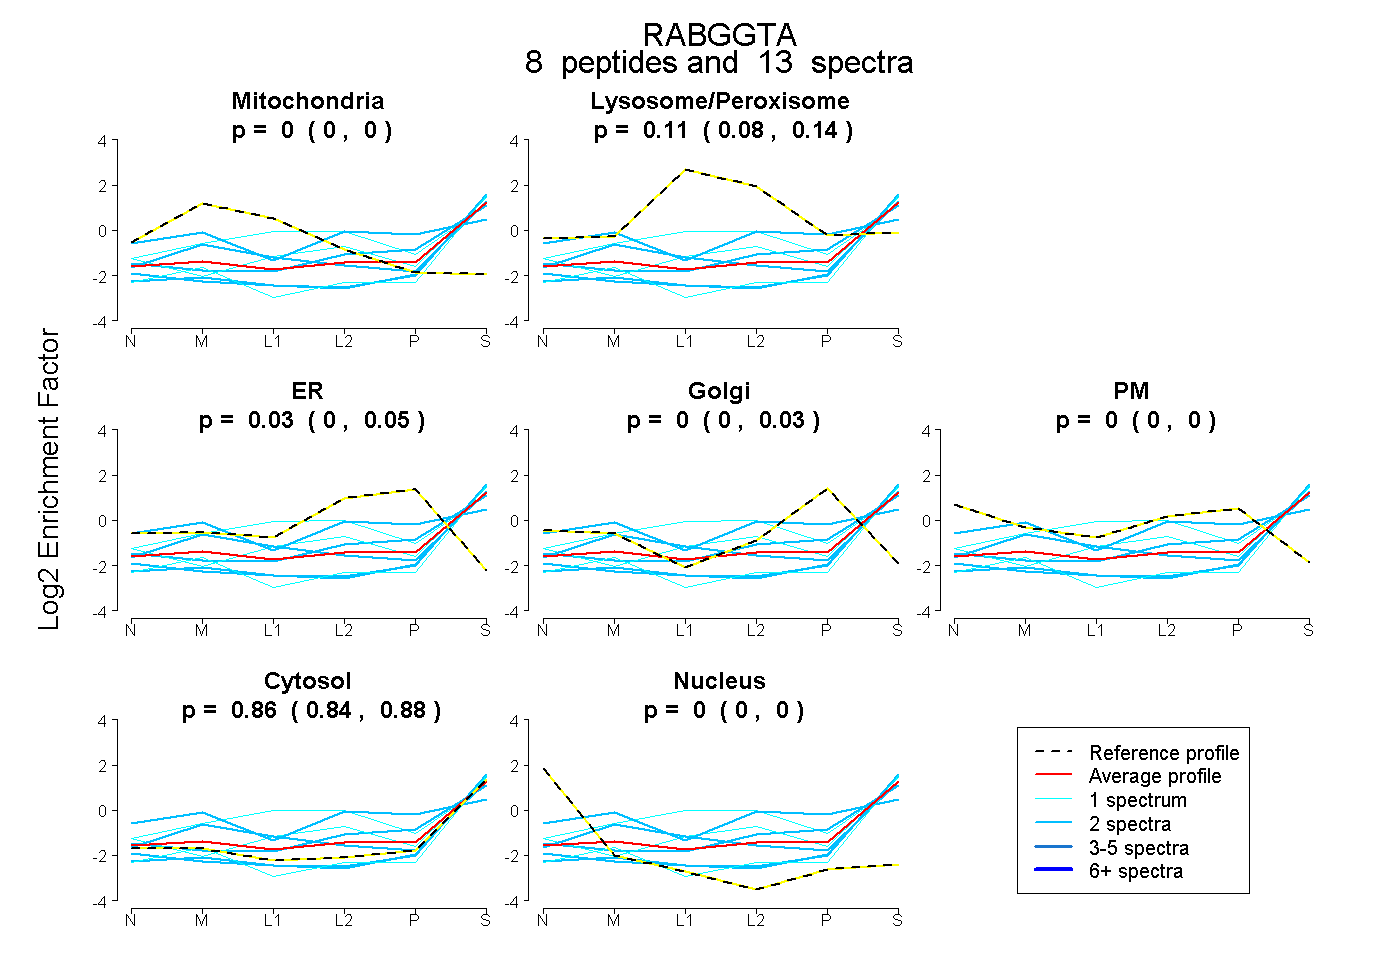
0.000 | 0.001
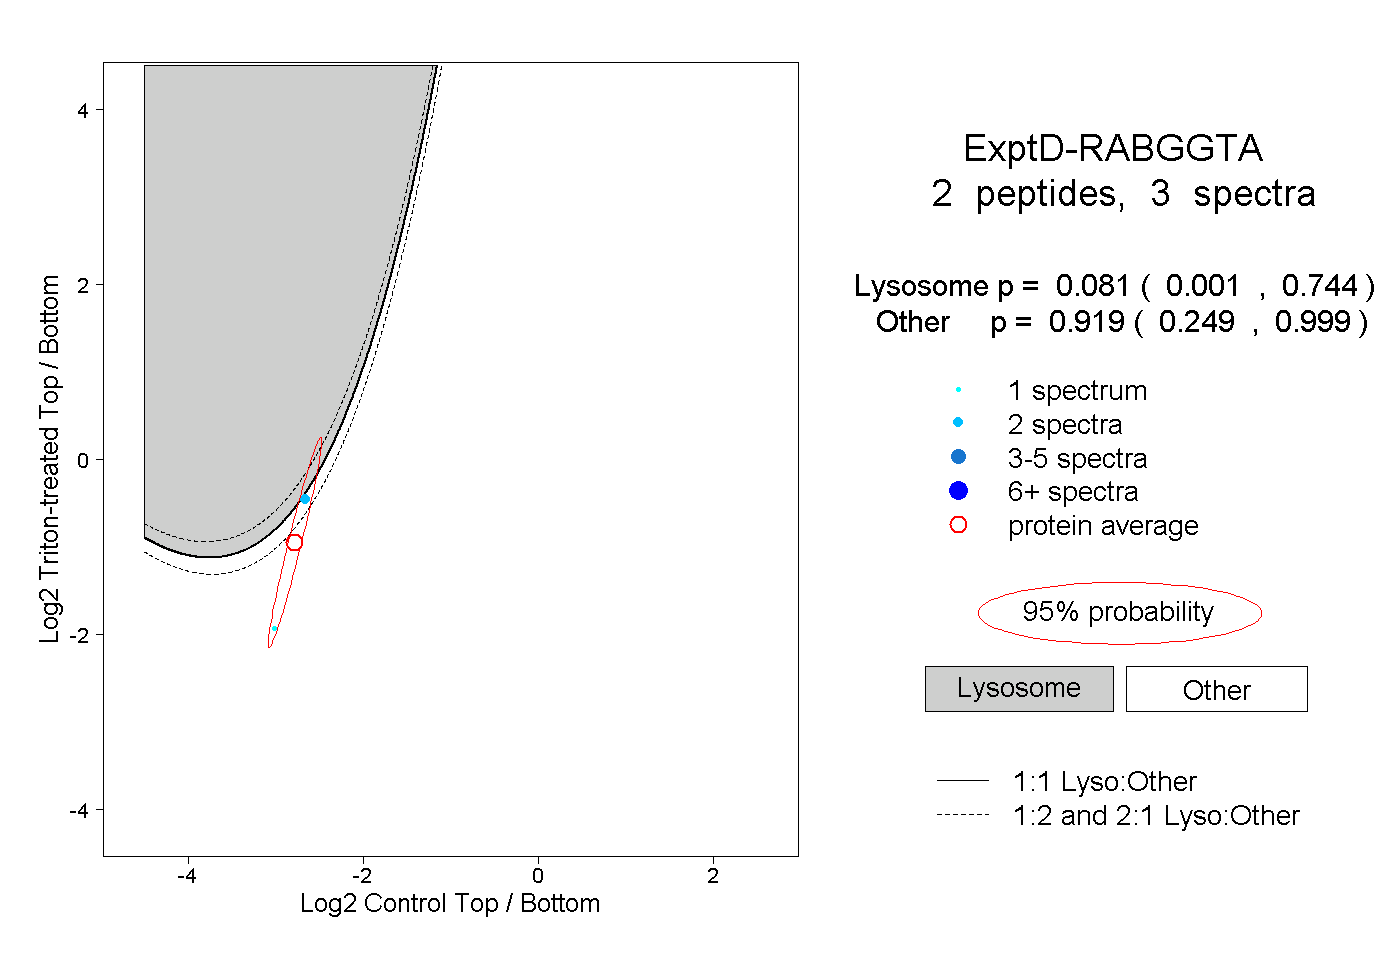
0.081 | 0.137
0.000 | 0.054
0.000 | 0.029
0.000 | 0.000
0.835 | 0.880
0.000 | 0.000