 20
20peptides
spectra
0.000 | 0.007
0.000 | 0.005
0.000 | 0.000
0.000 | 0.000
0.000 | 0.000
0.000 | 0.000
0.989 | 1.000
0.000 | 0.000
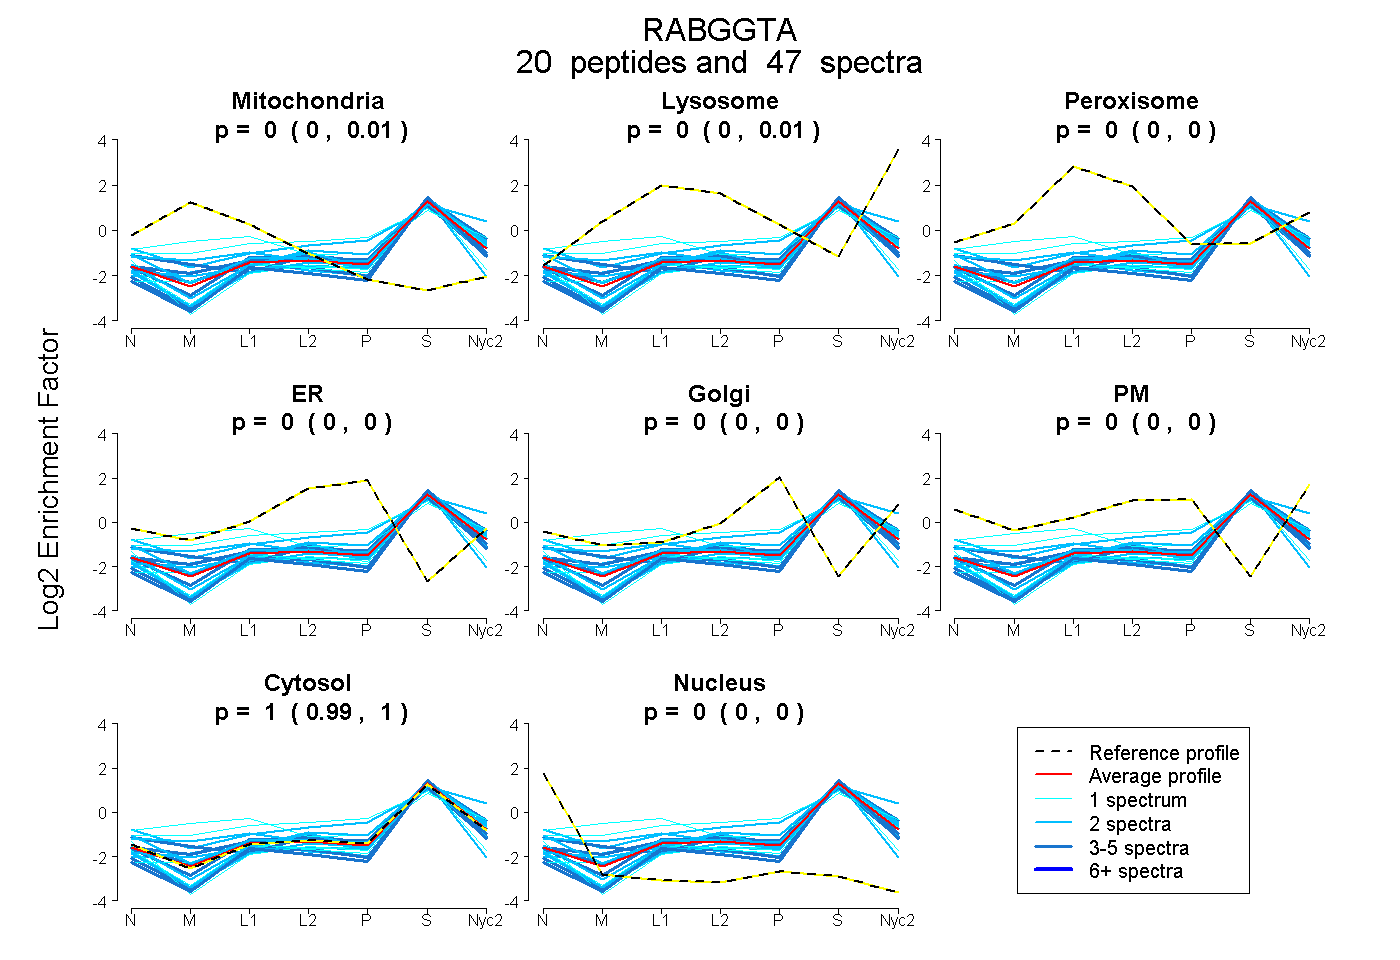
| Plot | Mito | Lyso | Perox | ER | Golgi | PM | Cytosol | Nucleus | |||||
| Expt A |
20 peptides |
47 spectra |
|
0.002 0.000 | 0.007 |
0.002 0.000 | 0.005 |
0.000 0.000 | 0.000 |
0.000 0.000 | 0.000 |
0.000 0.000 | 0.000 |
0.000 0.000 | 0.000 |
0.997 0.989 | 1.000 |
0.000 0.000 | 0.000 |
| 2 spectra, VIWTGSDSQK | 0.027 | 0.177 | 0.000 | 0.000 | 0.000 | 0.000 | 0.795 | 0.000 | ||
| 3 spectra, DSATDEQLFR | 0.124 | 0.000 | 0.000 | 0.000 | 0.000 | 0.000 | 0.876 | 0.000 | ||
| 2 spectra, SCLLPQLHPQPDSGPQGR | 0.032 | 0.000 | 0.015 | 0.000 | 0.000 | 0.000 | 0.919 | 0.034 | ||
| 2 spectra, EVLQHLETEK | 0.000 | 0.000 | 0.000 | 0.000 | 0.000 | 0.000 | 1.000 | 0.000 | ||
| 2 spectra, STVLQSELESCK | 0.000 | 0.000 | 0.000 | 0.022 | 0.000 | 0.000 | 0.978 | 0.000 | ||
| 2 spectra, FLLENSVLK | 0.000 | 0.000 | 0.000 | 0.000 | 0.000 | 0.000 | 1.000 | 0.000 | ||
| 1 spectrum, AVDPMR | 0.000 | 0.000 | 0.000 | 0.000 | 0.000 | 0.000 | 1.000 | 0.000 | ||
| 2 spectra, AAYLDDLR | 0.051 | 0.000 | 0.000 | 0.000 | 0.000 | 0.000 | 0.949 | 0.000 | ||
| 4 spectra, CWLLSR | 0.066 | 0.000 | 0.015 | 0.000 | 0.000 | 0.000 | 0.919 | 0.000 | ||
| 1 spectrum, LPEPNWAR | 0.000 | 0.000 | 0.000 | 0.000 | 0.000 | 0.000 | 1.000 | 0.000 | ||
| 2 spectra, LQELLLCNNR | 0.000 | 0.051 | 0.000 | 0.000 | 0.000 | 0.000 | 0.949 | 0.000 | ||
| 1 spectrum, LVLLNLQGNSLCQEEGIQER | 0.000 | 0.000 | 0.000 | 0.000 | 0.000 | 0.000 | 0.897 | 0.103 | ||
| 4 spectra, ALPPALAALR | 0.000 | 0.000 | 0.000 | 0.000 | 0.000 | 0.000 | 1.000 | 0.000 | ||
| 2 spectra, AELGFLESCLR | 0.000 | 0.000 | 0.000 | 0.000 | 0.000 | 0.000 | 0.921 | 0.079 | ||
| 1 spectrum, LQQSAAIQPLVSCPR | 0.019 | 0.000 | 0.190 | 0.078 | 0.052 | 0.000 | 0.662 | 0.000 | ||
| 4 spectra, VLHLAHK | 0.000 | 0.000 | 0.000 | 0.000 | 0.000 | 0.000 | 0.993 | 0.007 | ||
| 1 spectrum, LYQSATQAVFQK | 0.171 | 0.097 | 0.121 | 0.000 | 0.000 | 0.000 | 0.610 | 0.000 | ||
| 4 spectra, ELELCAR | 0.000 | 0.000 | 0.000 | 0.000 | 0.000 | 0.000 | 1.000 | 0.000 | ||
| 2 spectra, DRPECWCR | 0.000 | 0.000 | 0.100 | 0.024 | 0.105 | 0.025 | 0.746 | 0.000 | ||
| 5 spectra, FLEADER | 0.000 | 0.048 | 0.000 | 0.000 | 0.000 | 0.000 | 0.952 | 0.000 |
| Plot | Mito | Lyso or Perox | ER | Golgi | PM | Cytosol | Nucleus | ||||||
| Expt B |
8 peptides |
13 spectra |
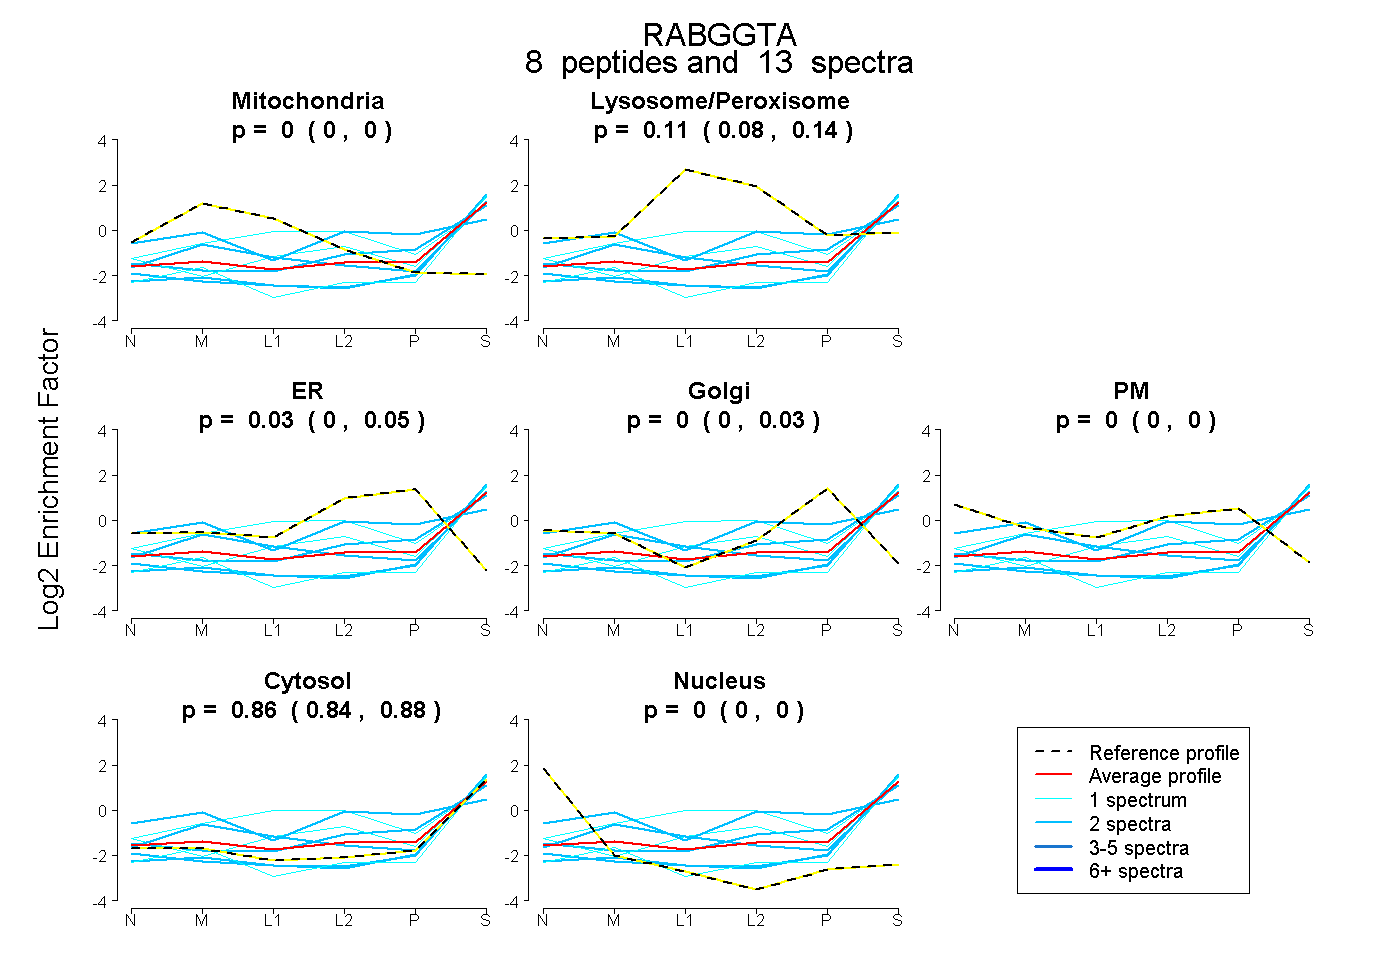 |
0.000 0.000 | 0.001 |
0.110 0.081 | 0.137 |
0.029 0.000 | 0.054 |
0.000 0.000 | 0.029 |
0.000 0.000 | 0.000 |
0.861 0.835 | 0.880 |
0.000 0.000 | 0.000 |
|||
| Plot | Lyso | Other | |||||||||||
| Expt C |
17 peptides |
46 spectra |
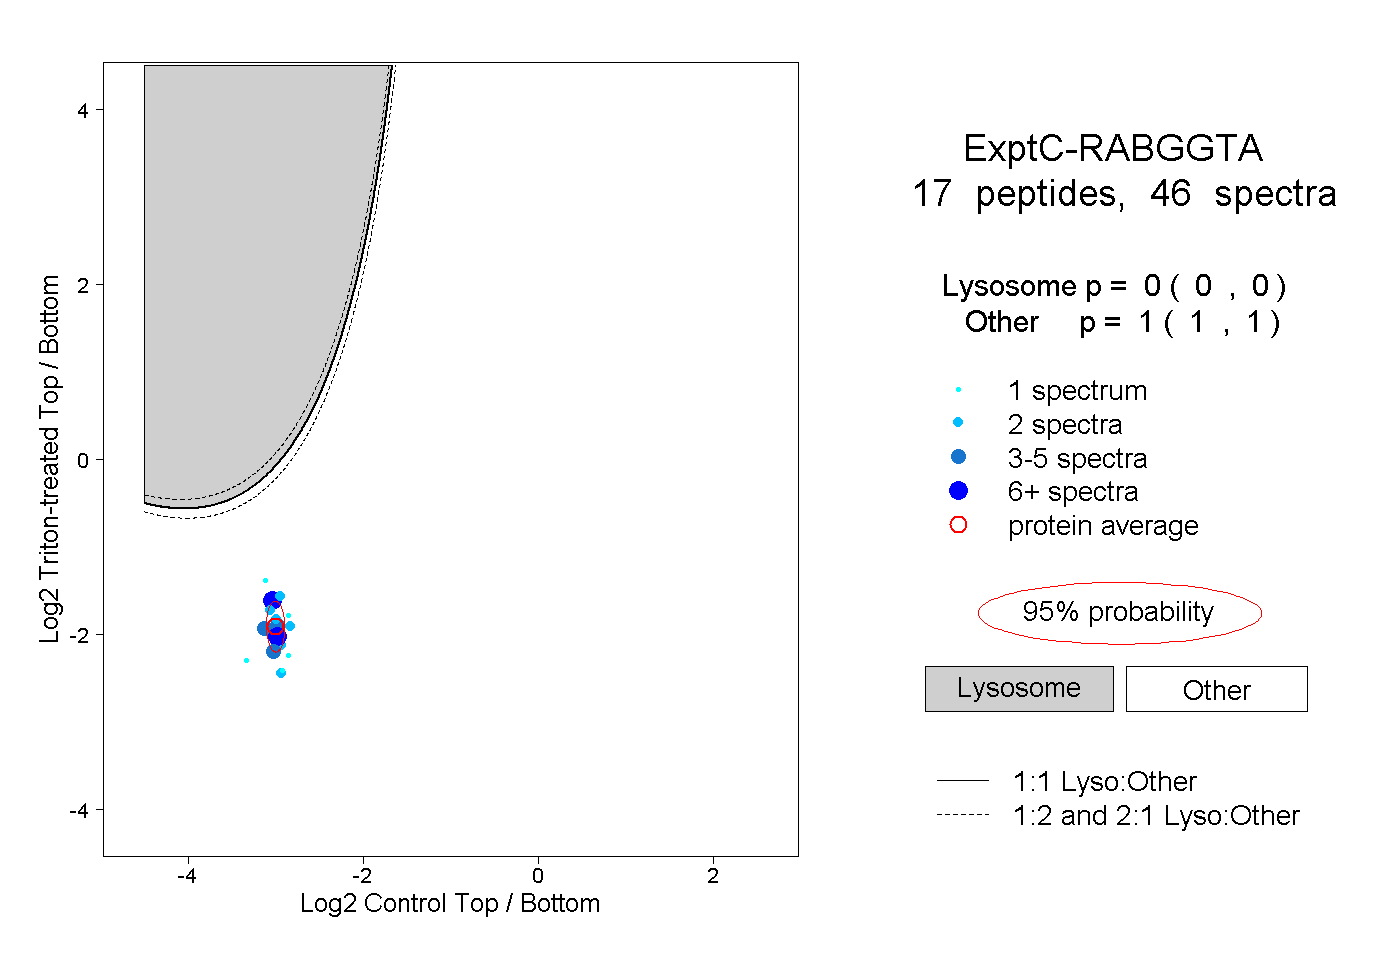 |
0.000 0.000 | 0.000 |
1.000 1.000 | 1.000 |
||||||||
| Plot | Lyso | Other | |||||||||||
| Expt D |
2 peptides |
3 spectra |
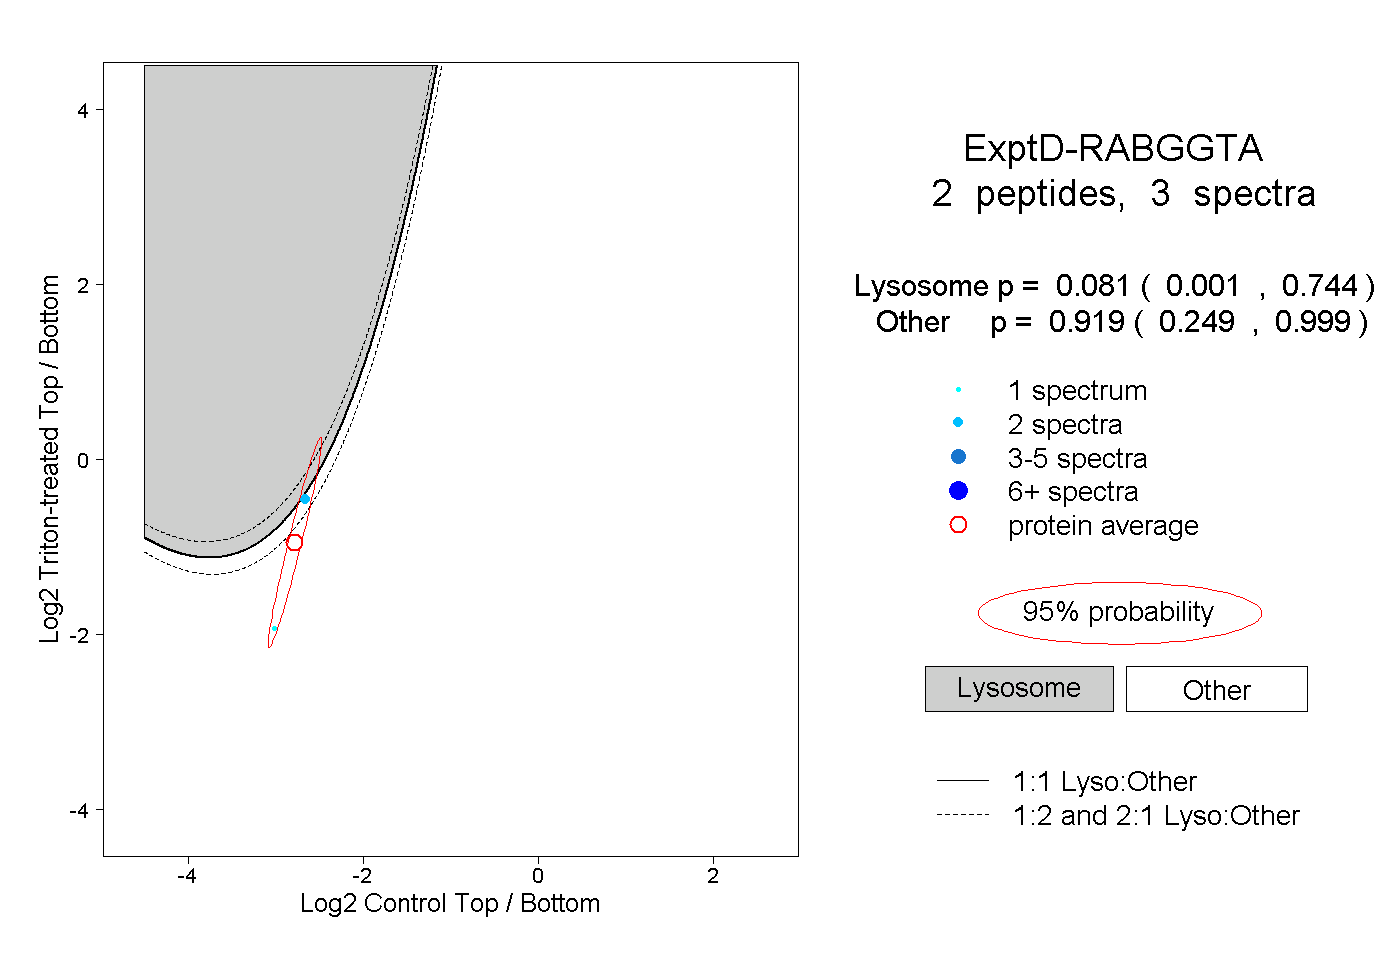 |
0.081 0.001 | 0.744 |
0.919 0.249 | 0.999 |