 2
2peptides
spectra
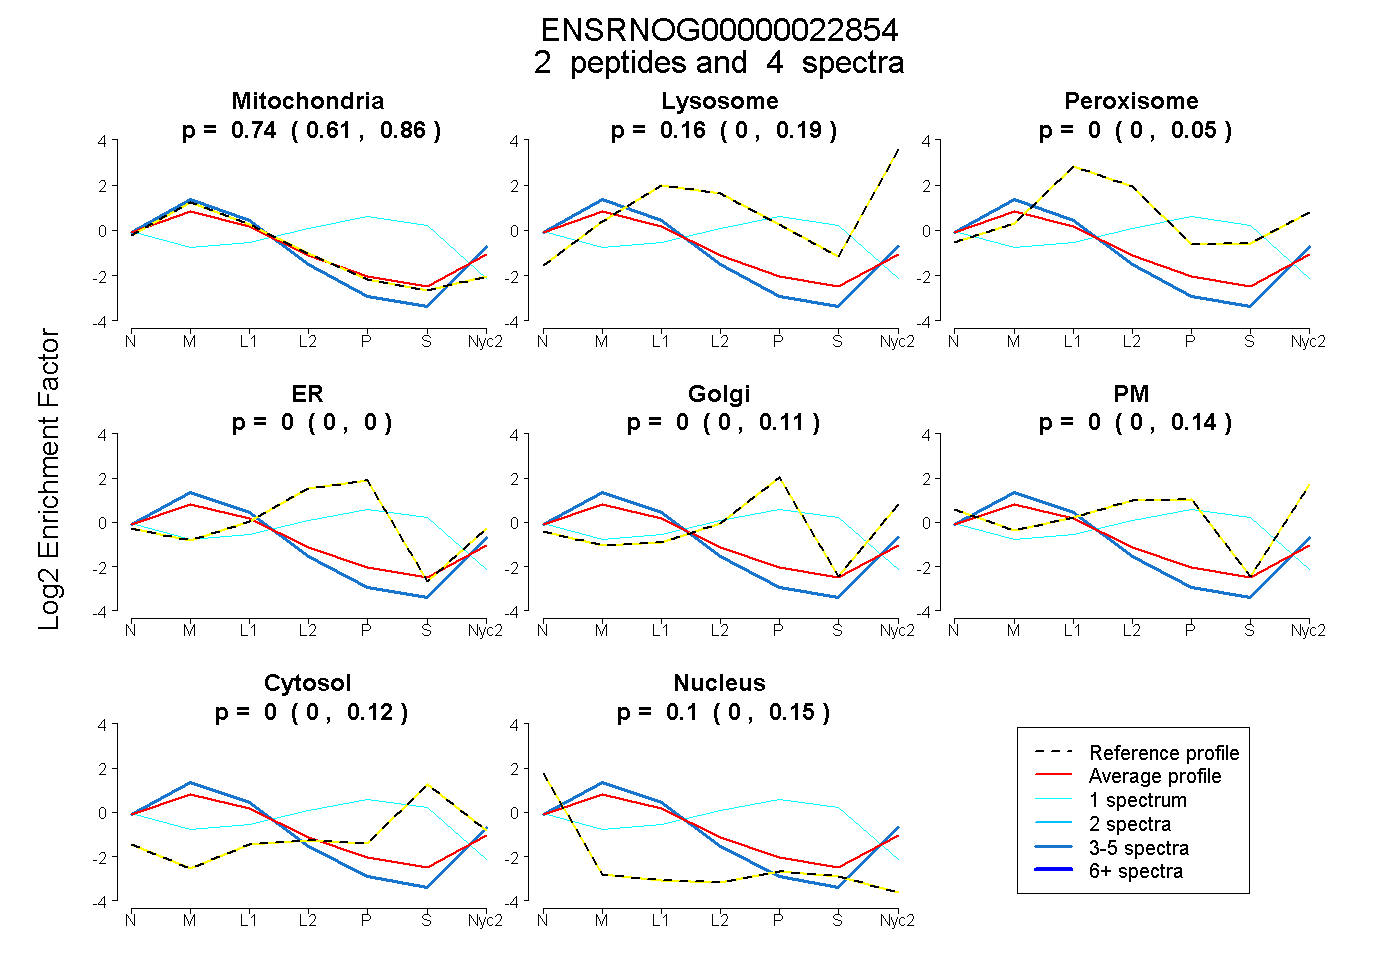
0.608 | 0.865
0.000 | 0.186
0.000 | 0.049
0.000 | 0.000
0.000 | 0.112
0.000 | 0.139
0.000 | 0.123
0.000 | 0.152
2peptides
spectra
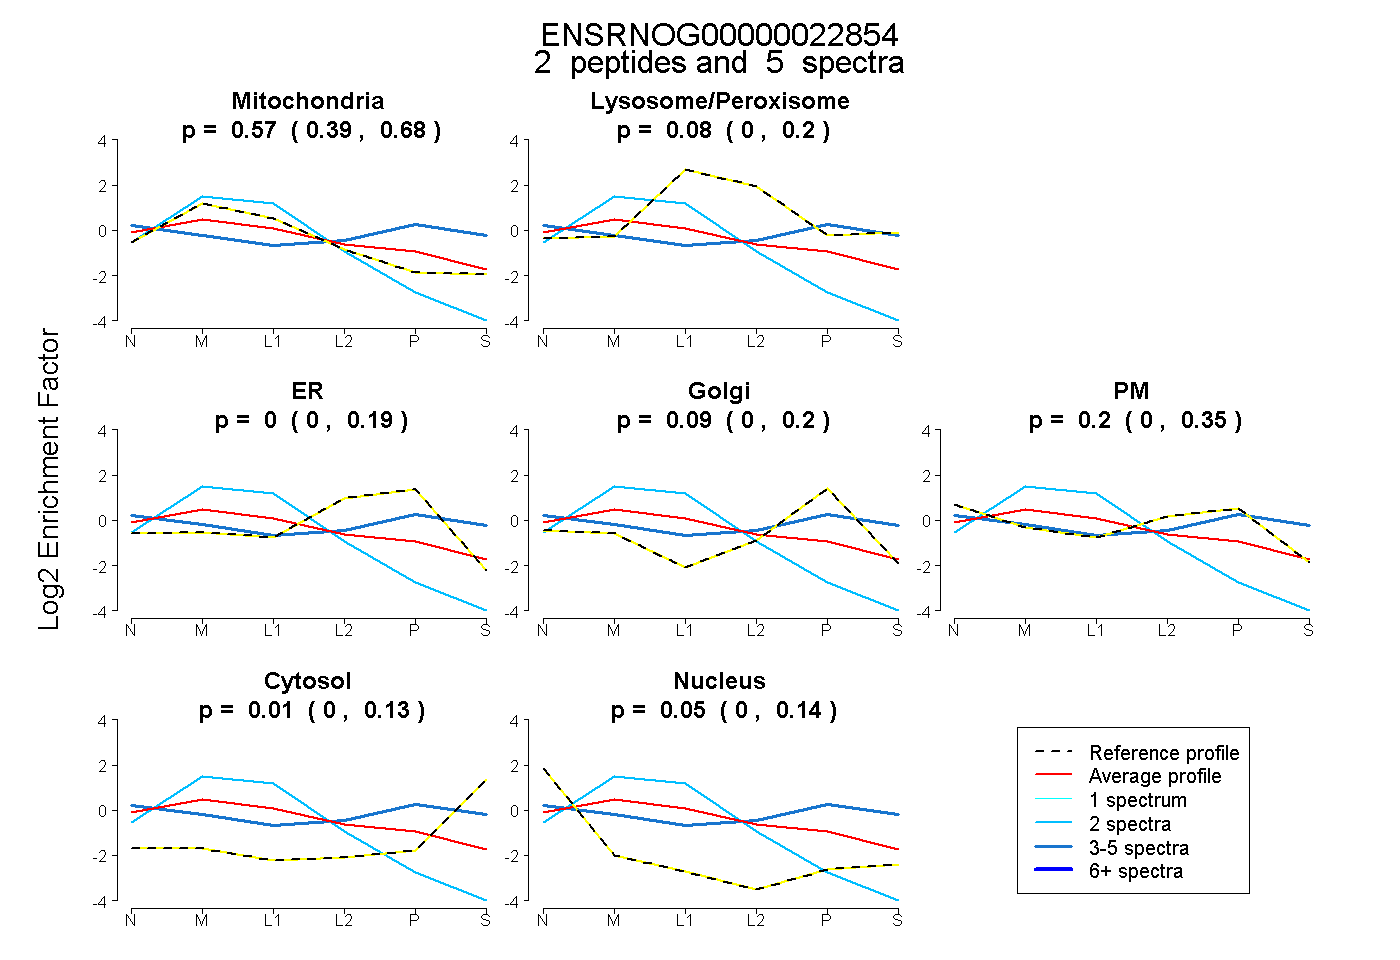
0.390 | 0.685
0.000 | 0.198
0.000 | 0.189
0.000 | 0.200
0.000 | 0.349
0.000 | 0.131
0.000 | 0.136
1peptide
spectra
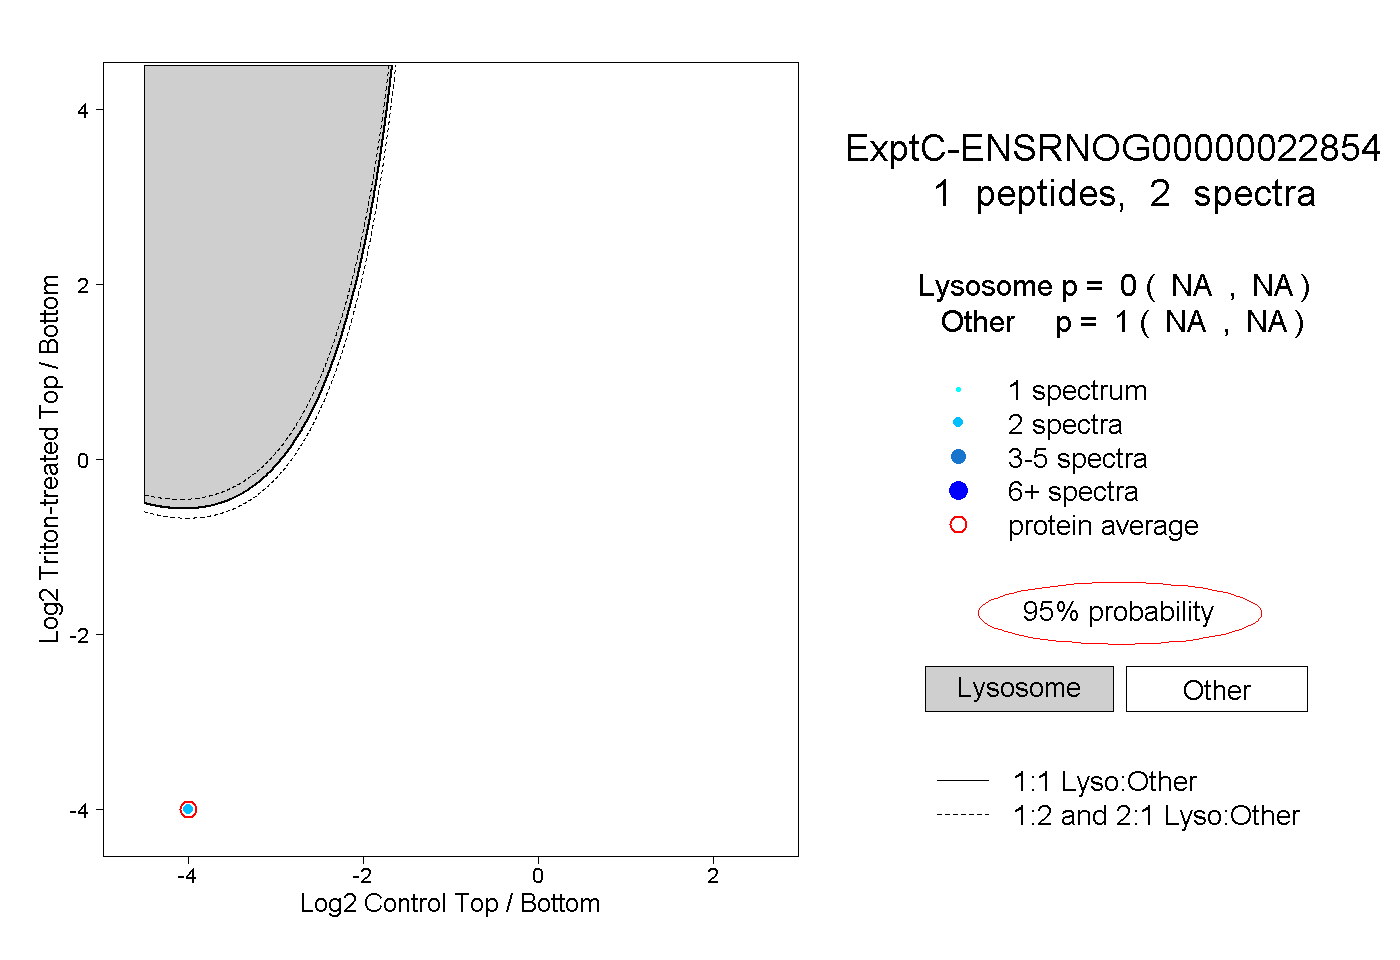
NA | NA
NA | NA
1peptide
spectrum
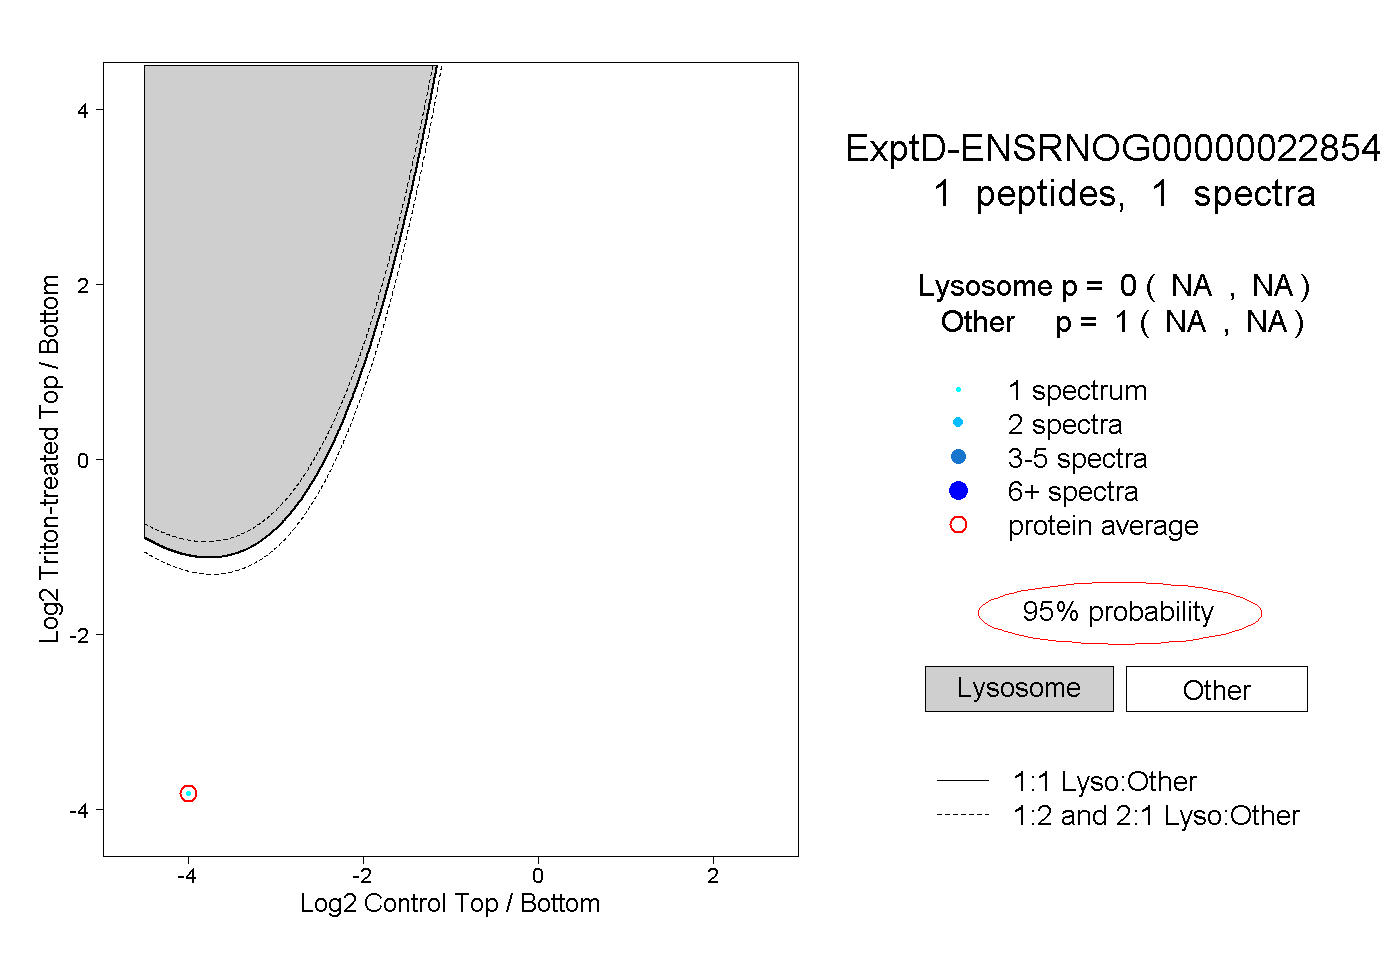
NA | NA
NA | NA