 1
1peptide
spectra
0.000 | 0.001
0.078 | 0.150
0.020 | 0.091
0.000 | 0.000
0.000 | 0.101
0.661 | 0.816
0.000 | 0.058
0.000 | 0.000
1peptide
spectrum
NA | NA
NA | NA
| Plot | Mito | Lyso | Perox | ER | Golgi | PM | Cytosol | Nucleus | |||||
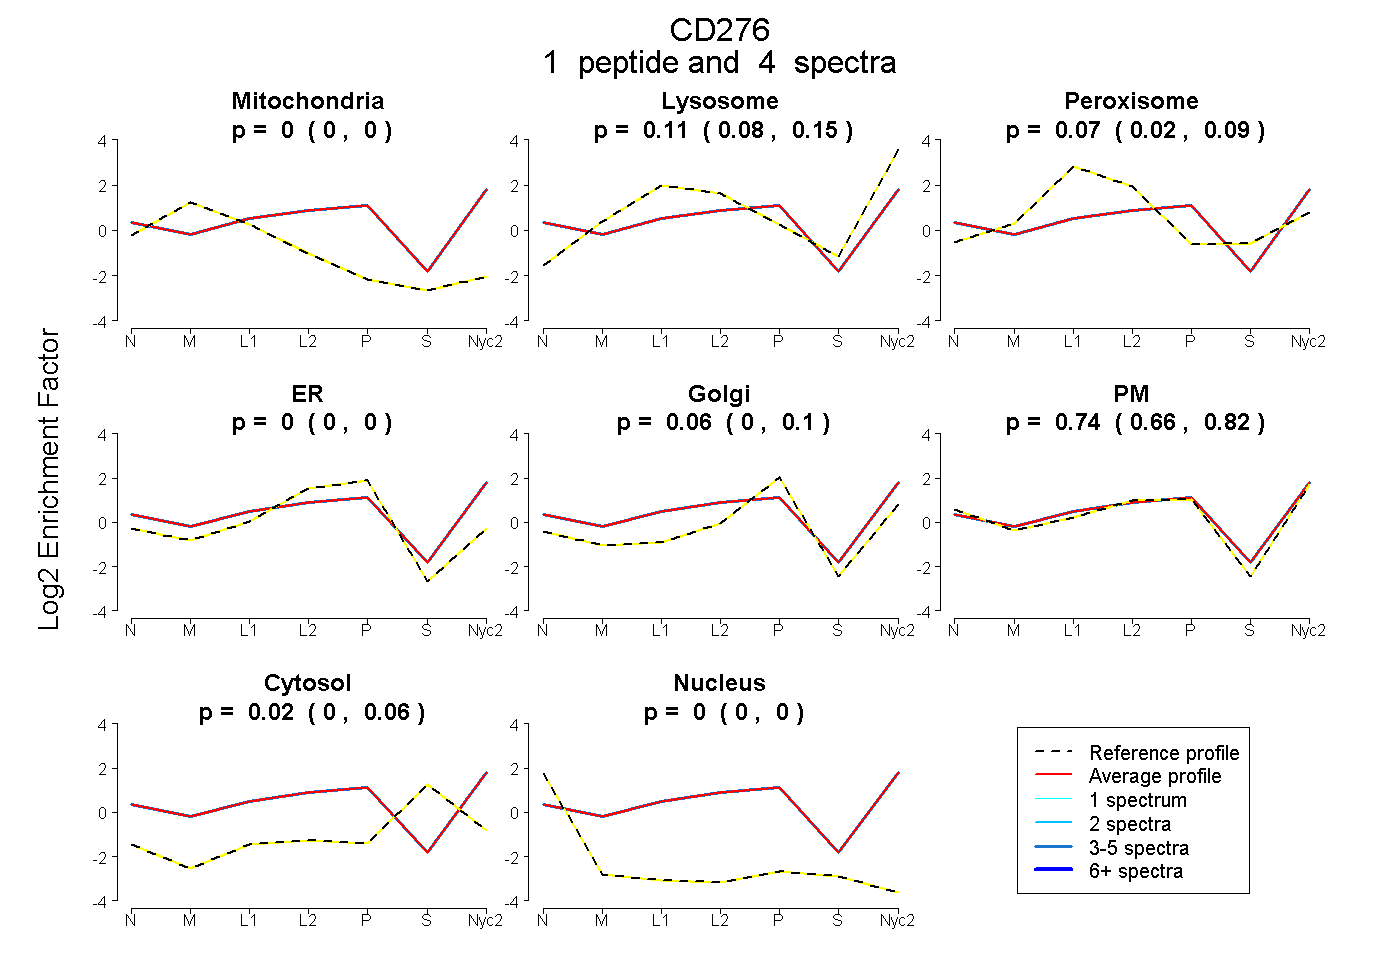
| Expt A |
1 peptide |
4 spectra |
|
0.000 0.000 | 0.001 |
0.114 0.078 | 0.150 |
0.065 0.020 | 0.091 |
0.000 0.000 | 0.000 |
0.065 0.000 | 0.101 |
0.739 0.661 | 0.816 |
0.018 0.000 | 0.058 |
0.000 0.000 | 0.000 |
||
| Plot | Lyso | Other | |||||||||||
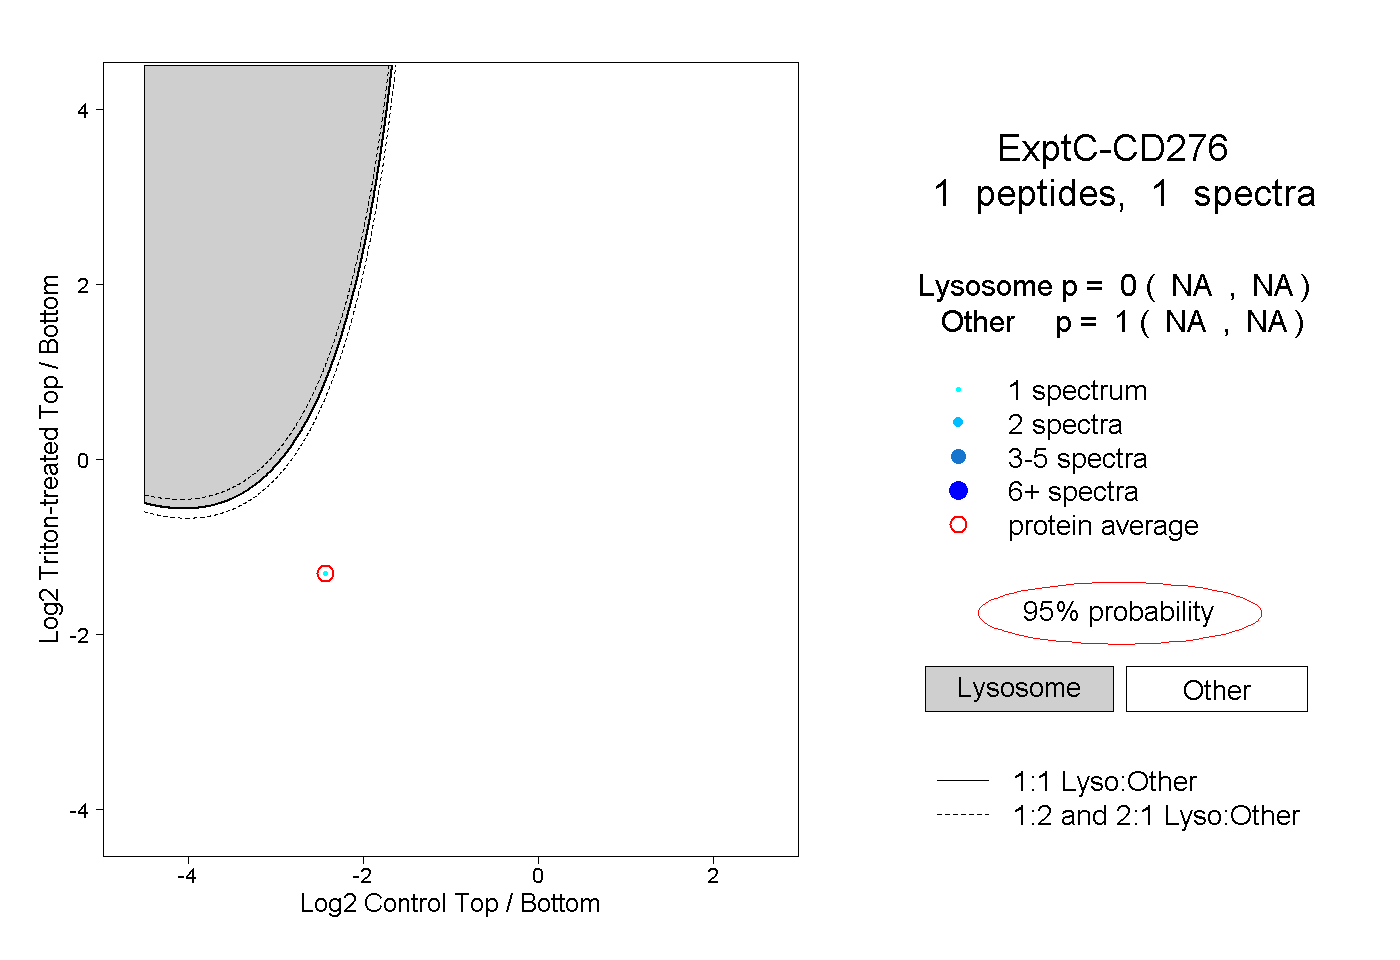
| Expt C |
1 peptide |
1 spectrum |
|
0.000 NA | NA |
1.000 NA | NA |