 4
4peptides
spectra
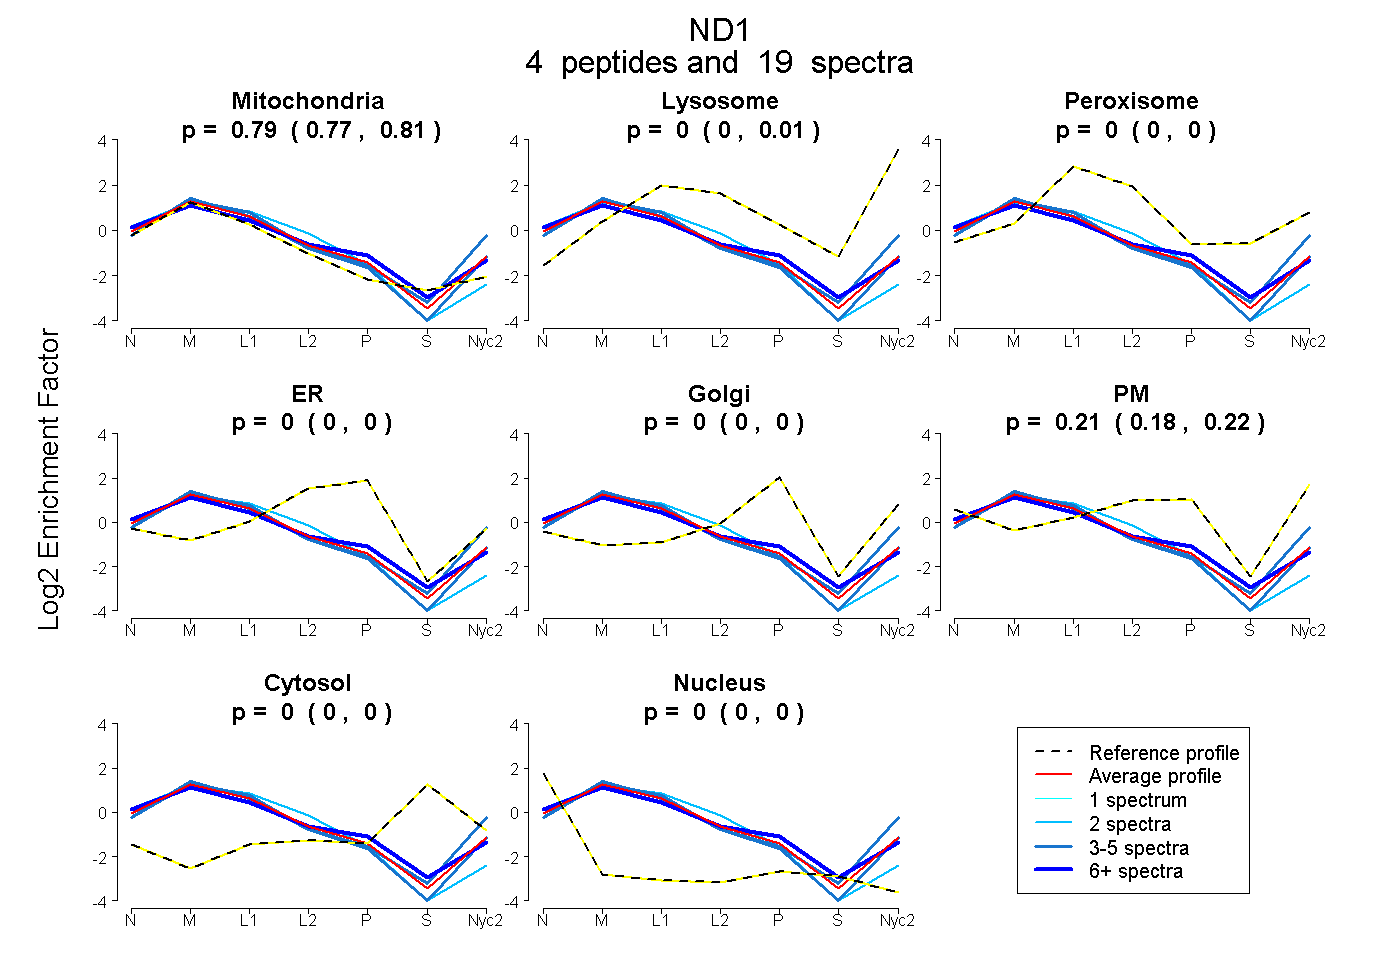
0.774 | 0.809
0.000 | 0.011
0.000 | 0.000
0.000 | 0.000
0.000 | 0.000
0.183 | 0.219
0.000 | 0.000
0.000 | 0.000
2peptides
spectra
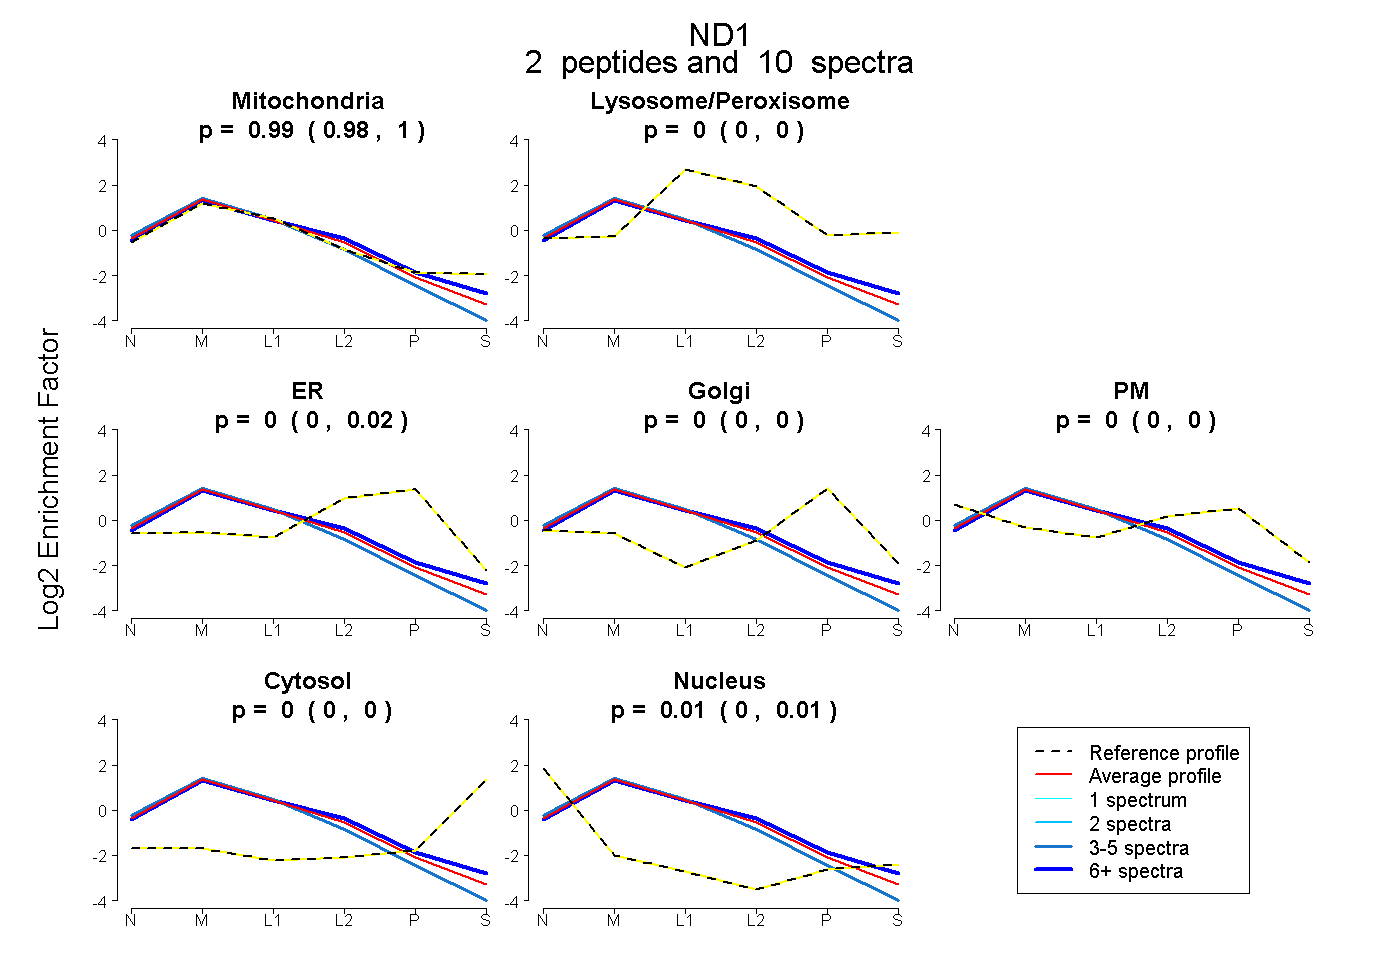
0.976 | 0.998
0.000 | 0.000
0.000 | 0.017
0.000 | 0.000
0.000 | 0.000
0.000 | 0.000
0.000 | 0.011
4peptides
spectra
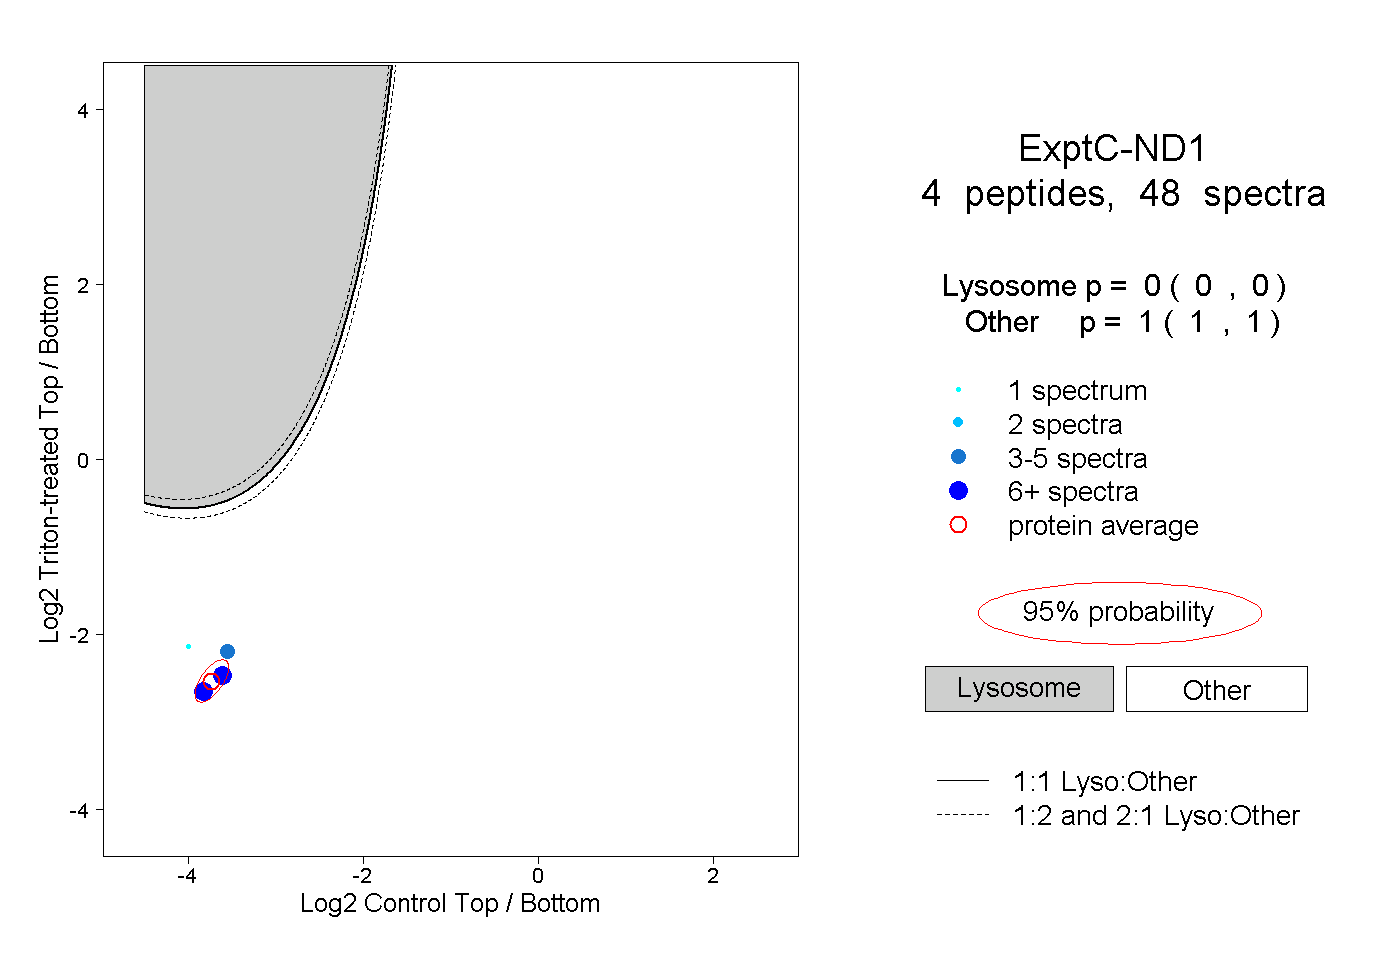
0.000 | 0.000
1.000 | 1.000
1peptide
spectrum
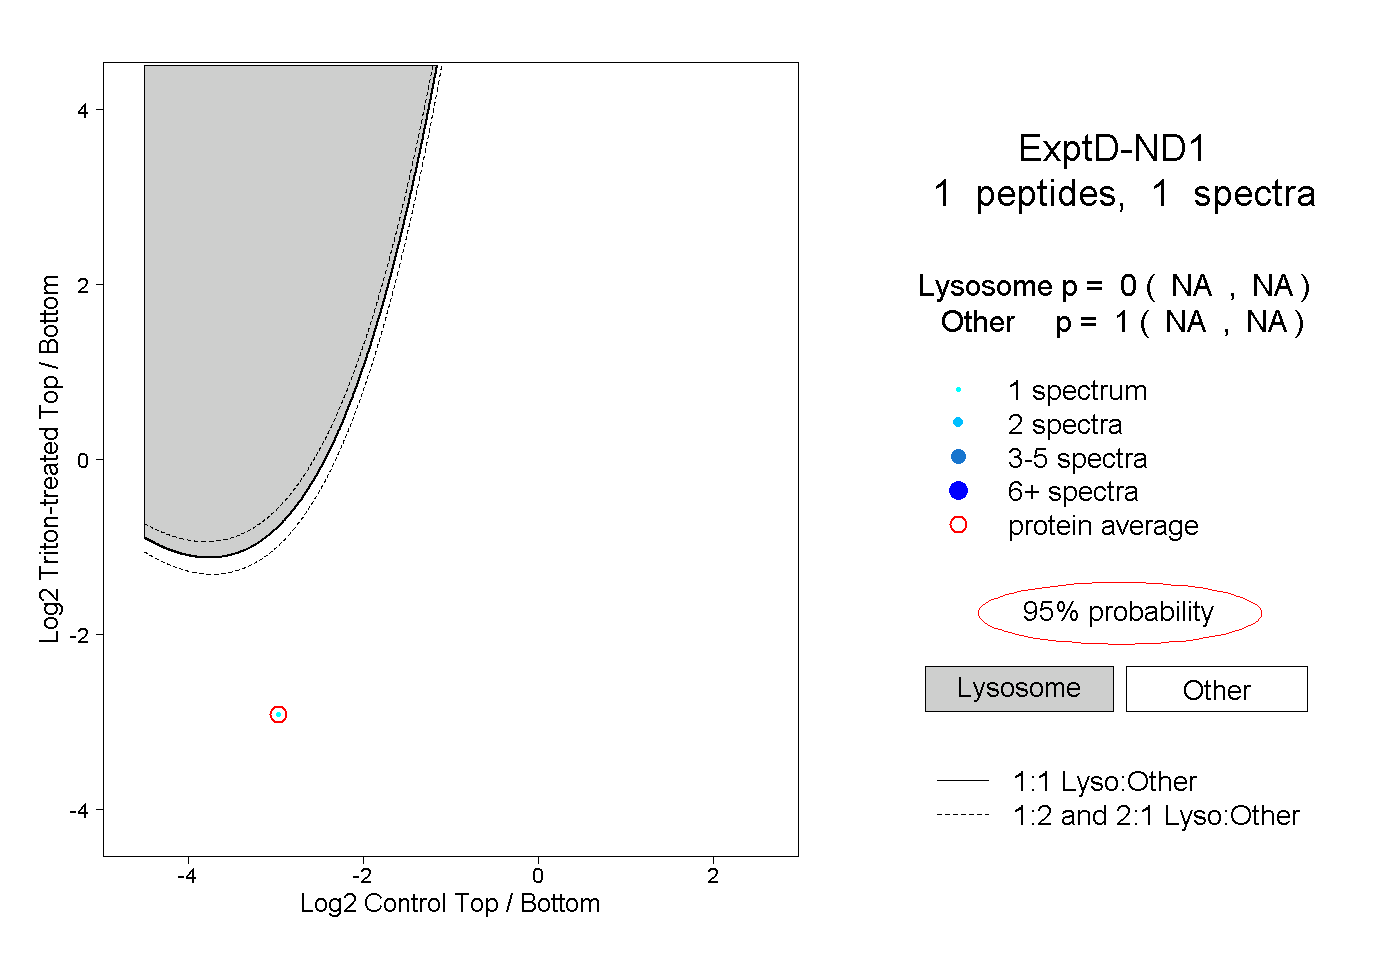
NA | NA
NA | NA