 1
1peptide
spectra
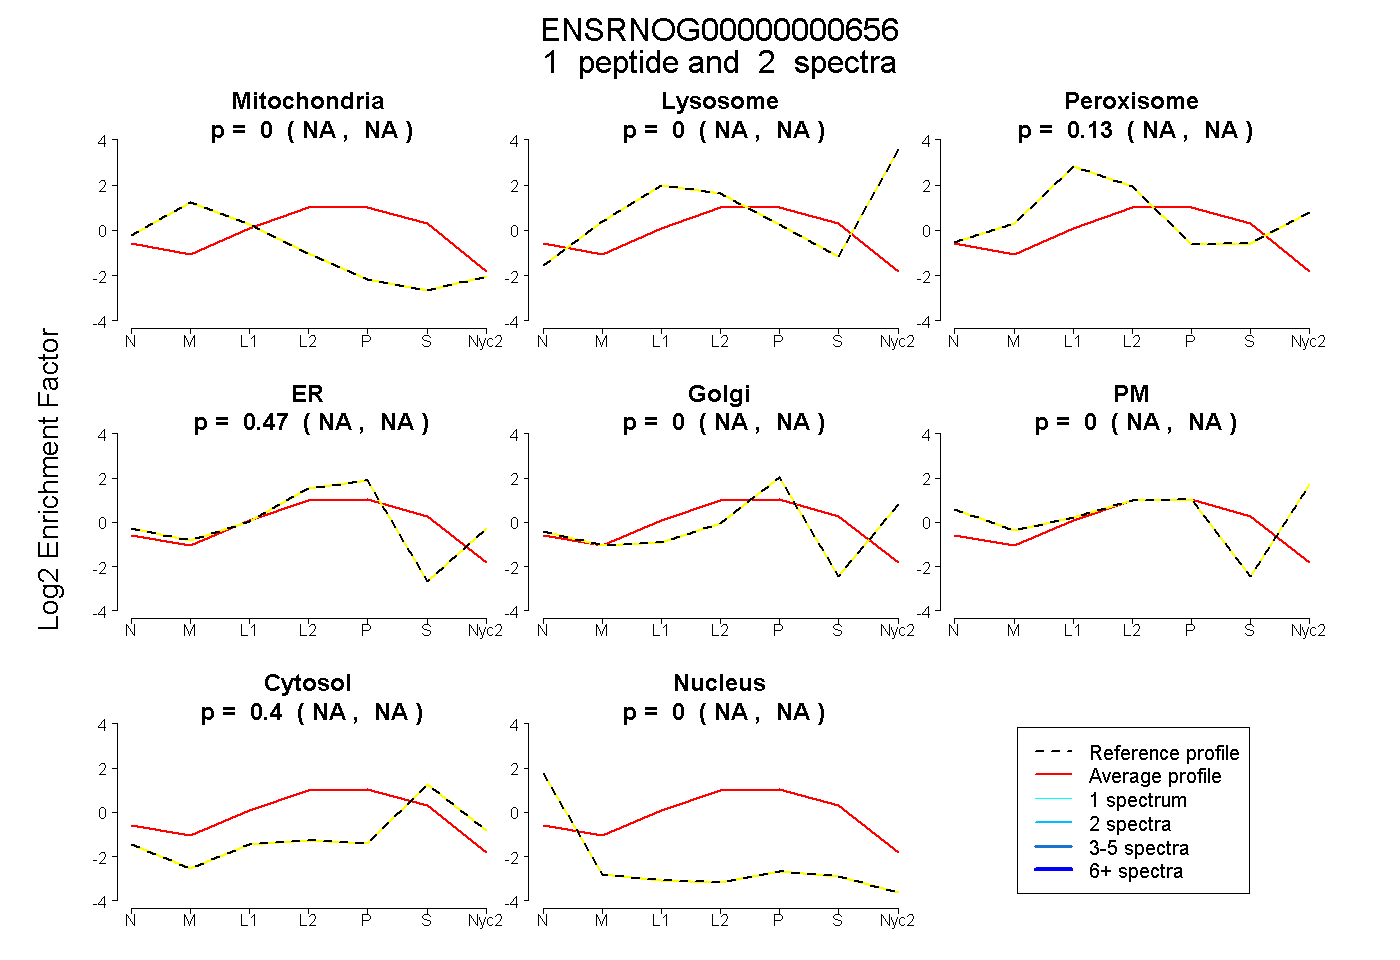
NA | NA
NA | NA
NA | NA
NA | NA
NA | NA
NA | NA
NA | NA
NA | NA
1peptide
spectra
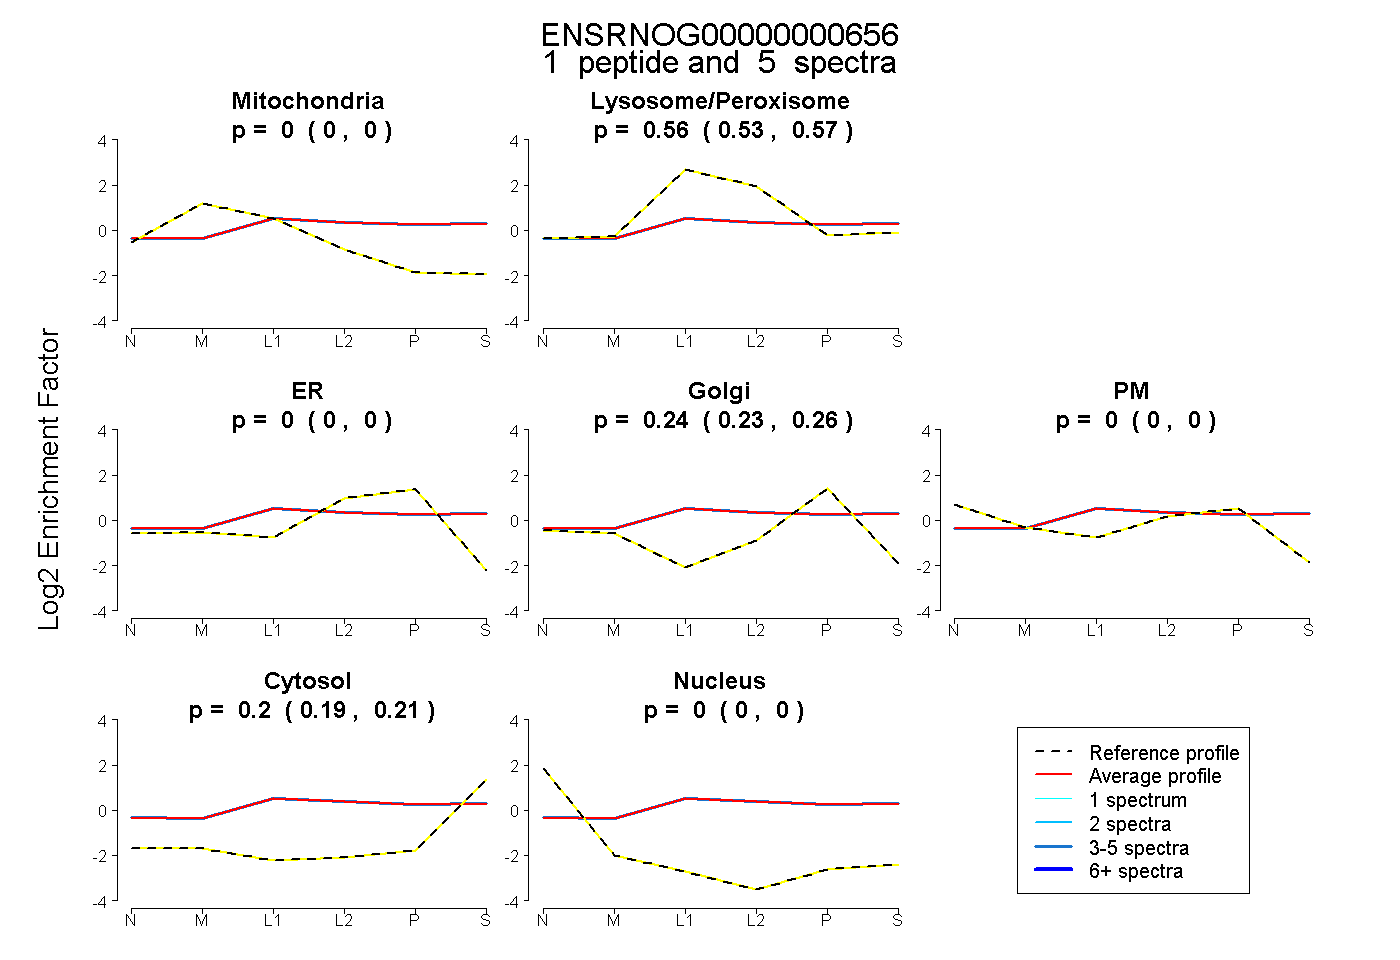
0.000 | 0.000
0.533 | 0.573
0.000 | 0.000
0.229 | 0.259
0.000 | 0.000
0.189 | 0.208
0.000 | 0.000
1peptide
spectrum
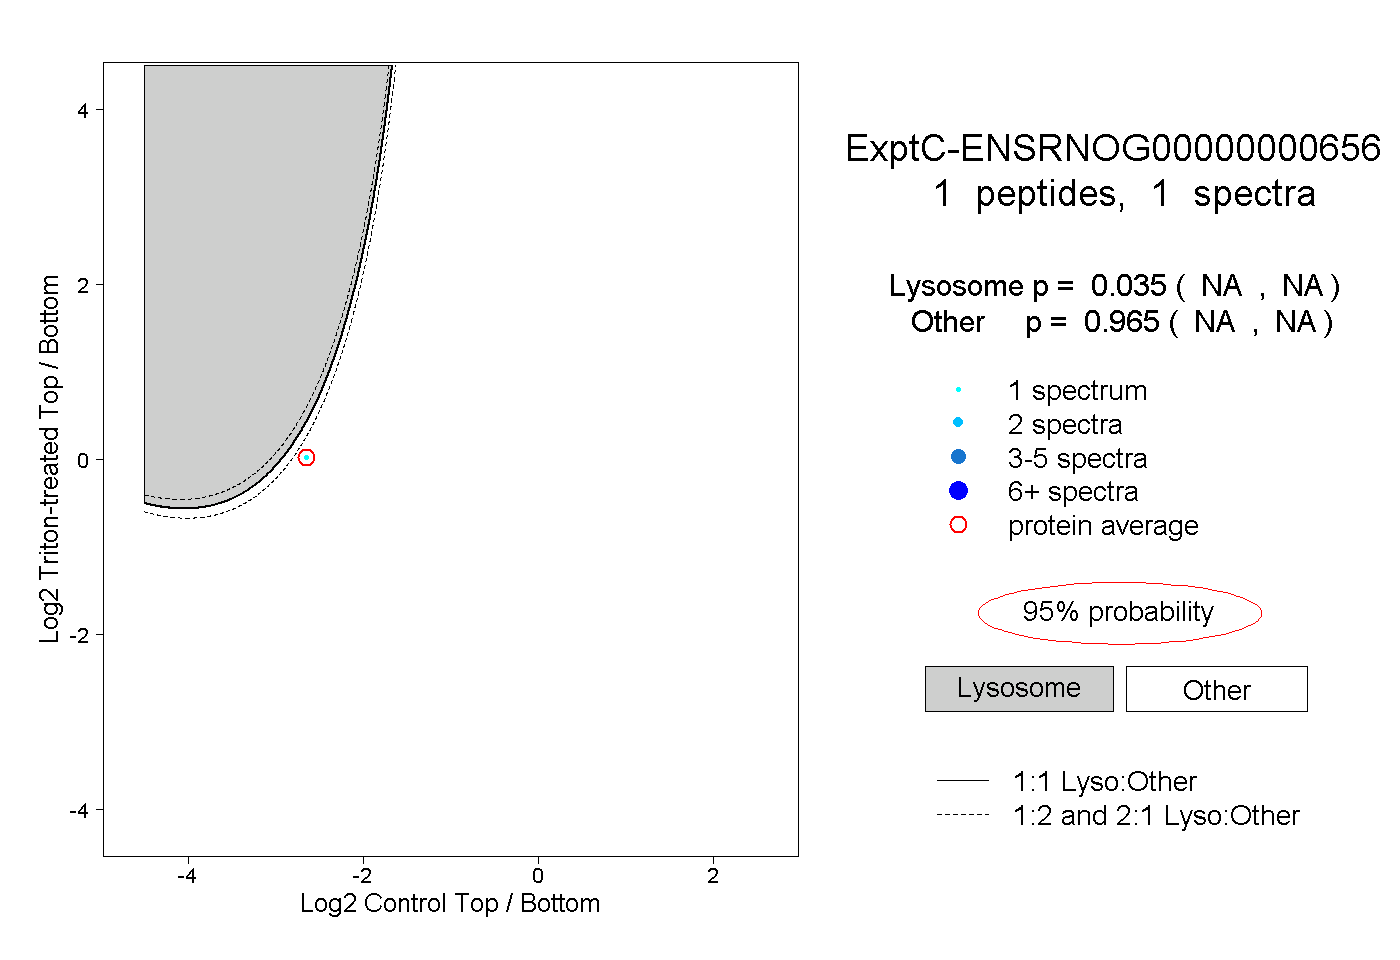
NA | NA
NA | NA