 7
7peptides
spectra
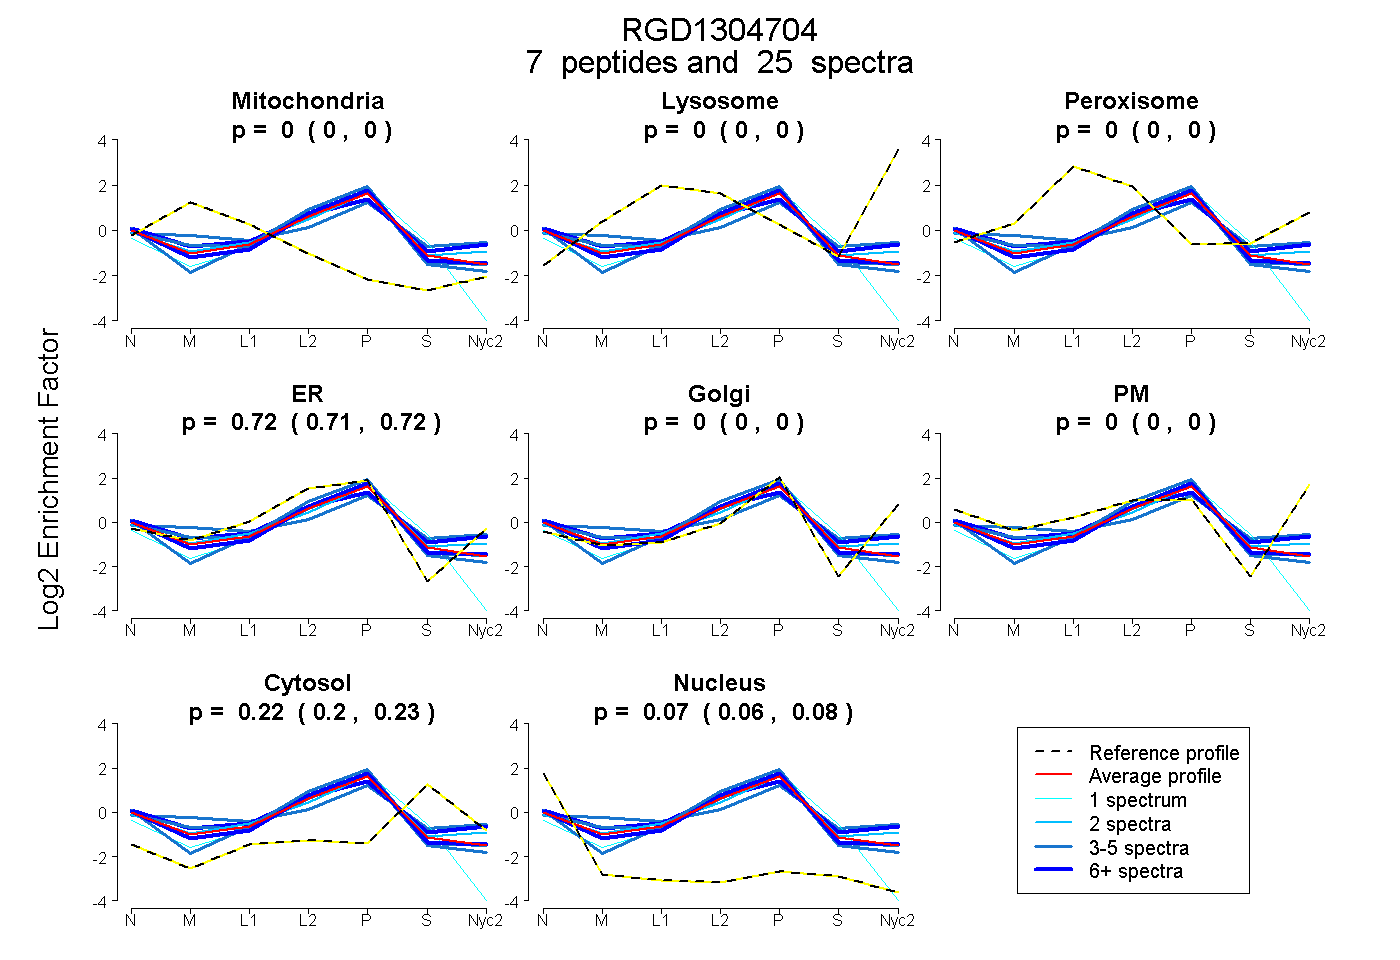
0.000 | 0.000
0.000 | 0.000
0.000 | 0.000
0.707 | 0.722
0.000 | 0.000
0.000 | 0.000
0.203 | 0.225
0.057 | 0.080
5peptides
spectra
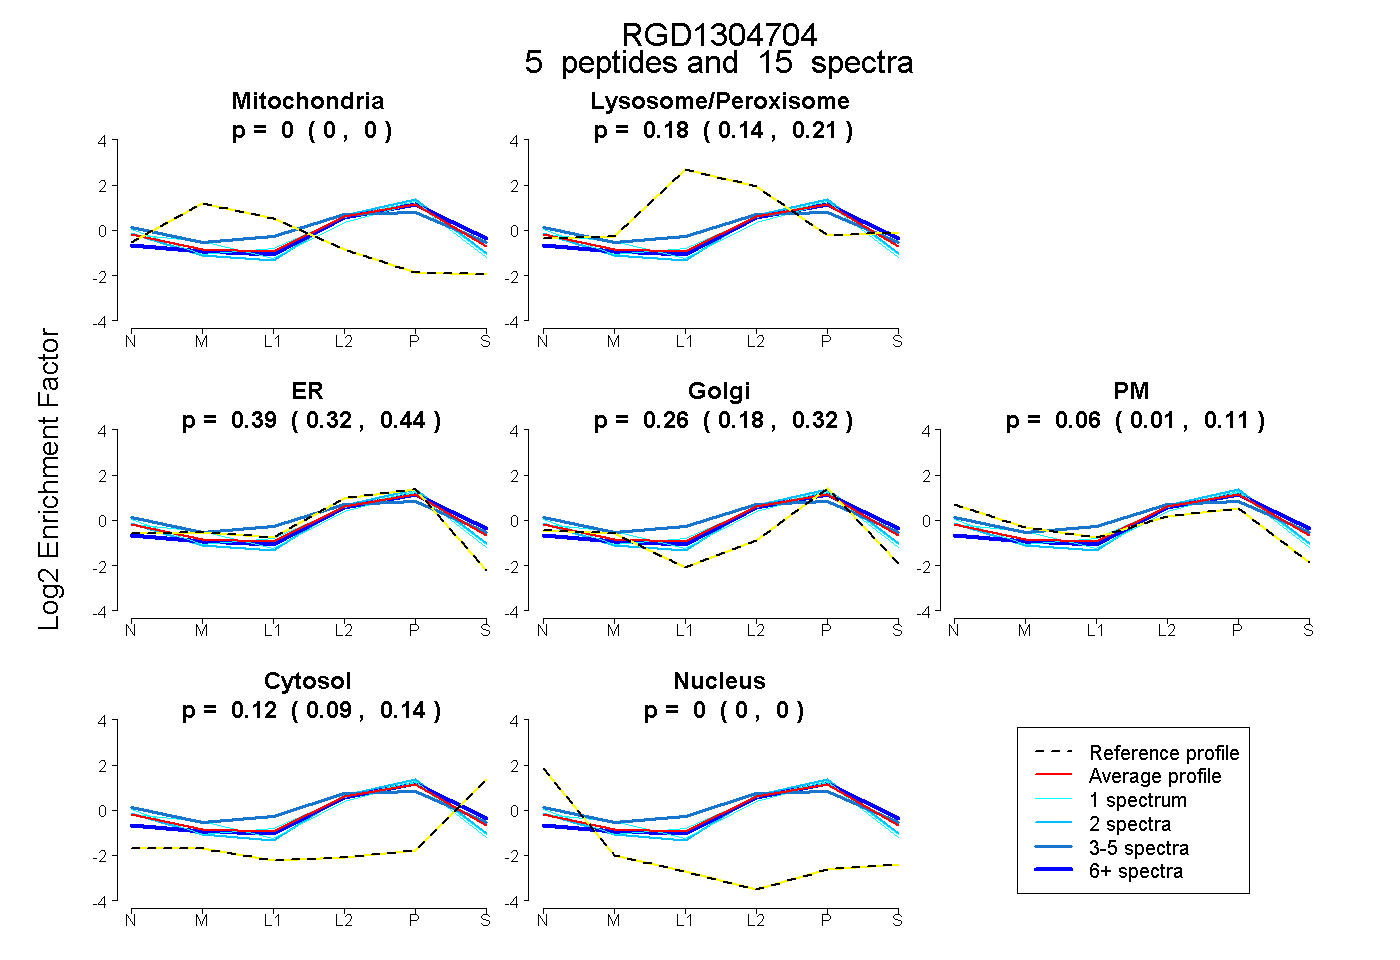
0.000 | 0.000
0.137 | 0.215
0.319 | 0.443
0.184 | 0.318
0.006 | 0.108
0.094 | 0.135
0.000 | 0.000
9peptides
spectra
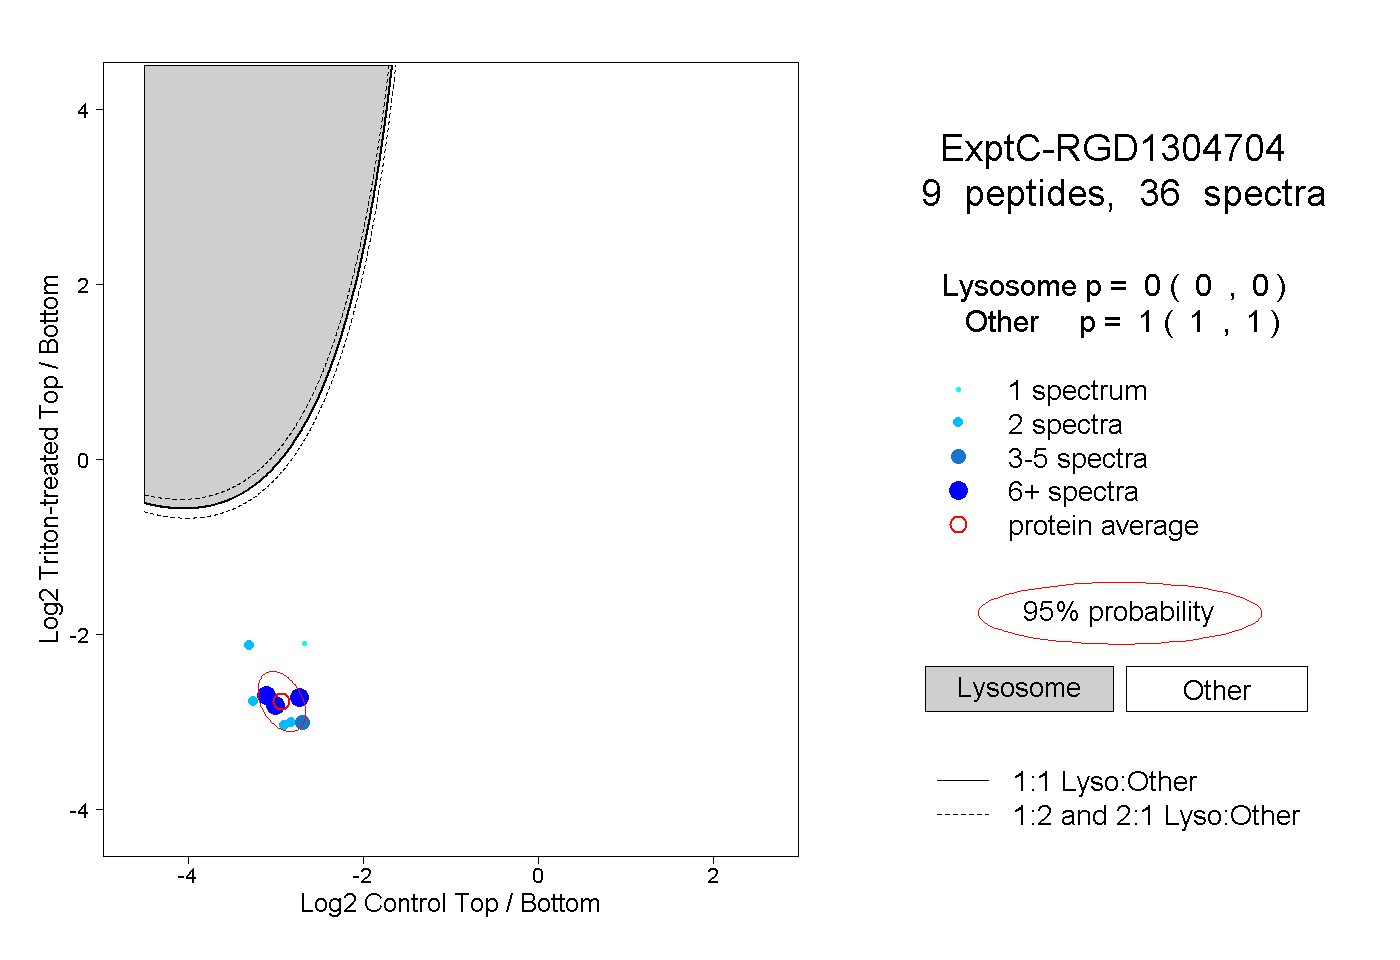
0.000 | 0.000
1.000 | 1.000
4peptides
spectra
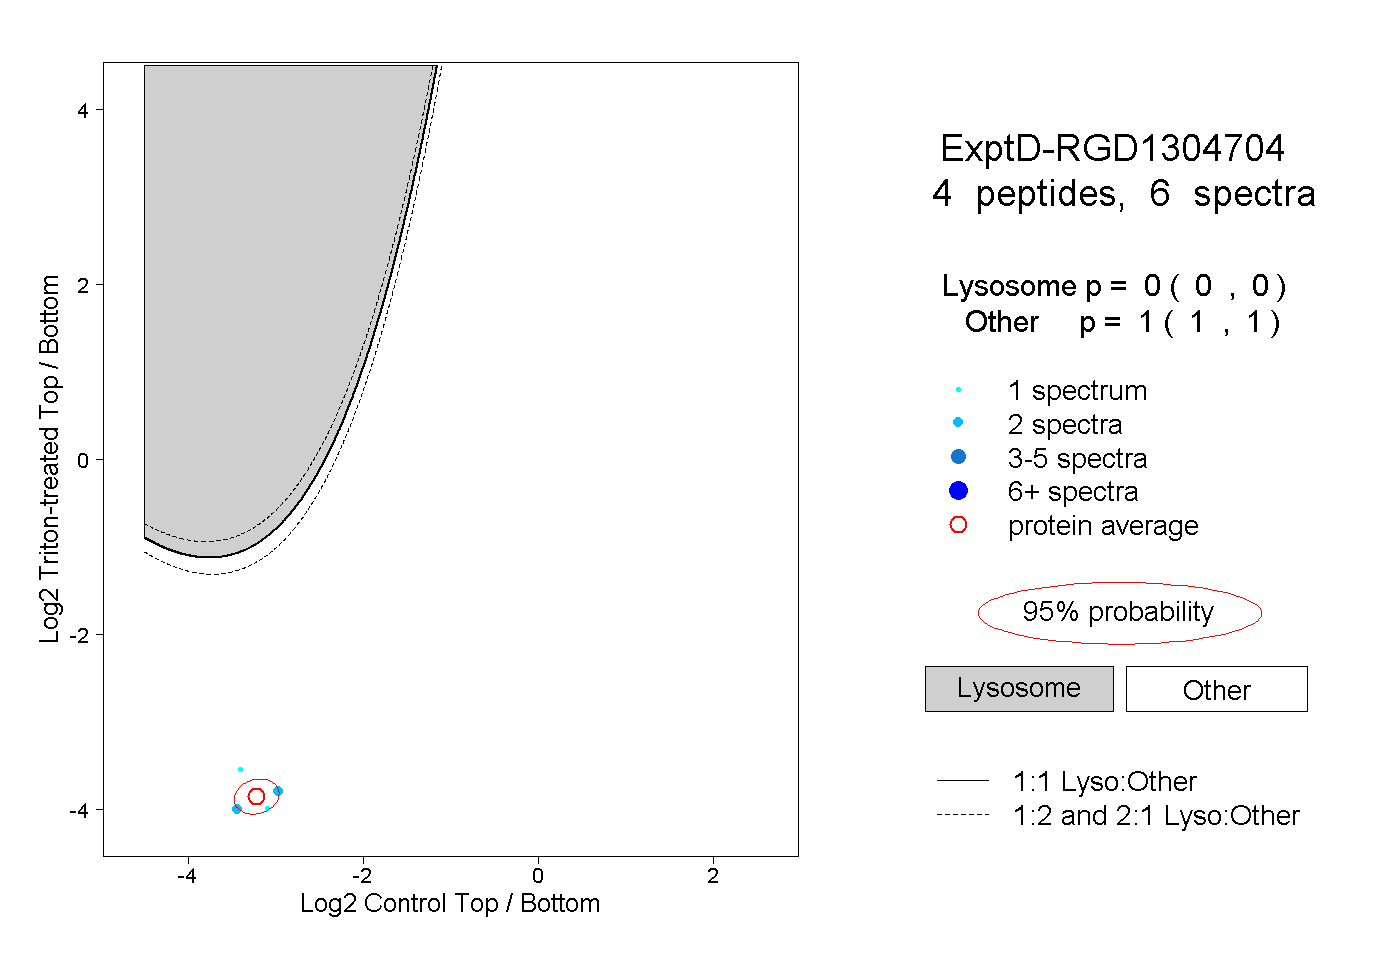
0.000 | 0.000
1.000 | 1.000