 2
2peptides
spectra
NA | NA
NA | NA
NA | NA
NA | NA
NA | NA
NA | NA
NA | NA
NA | NA
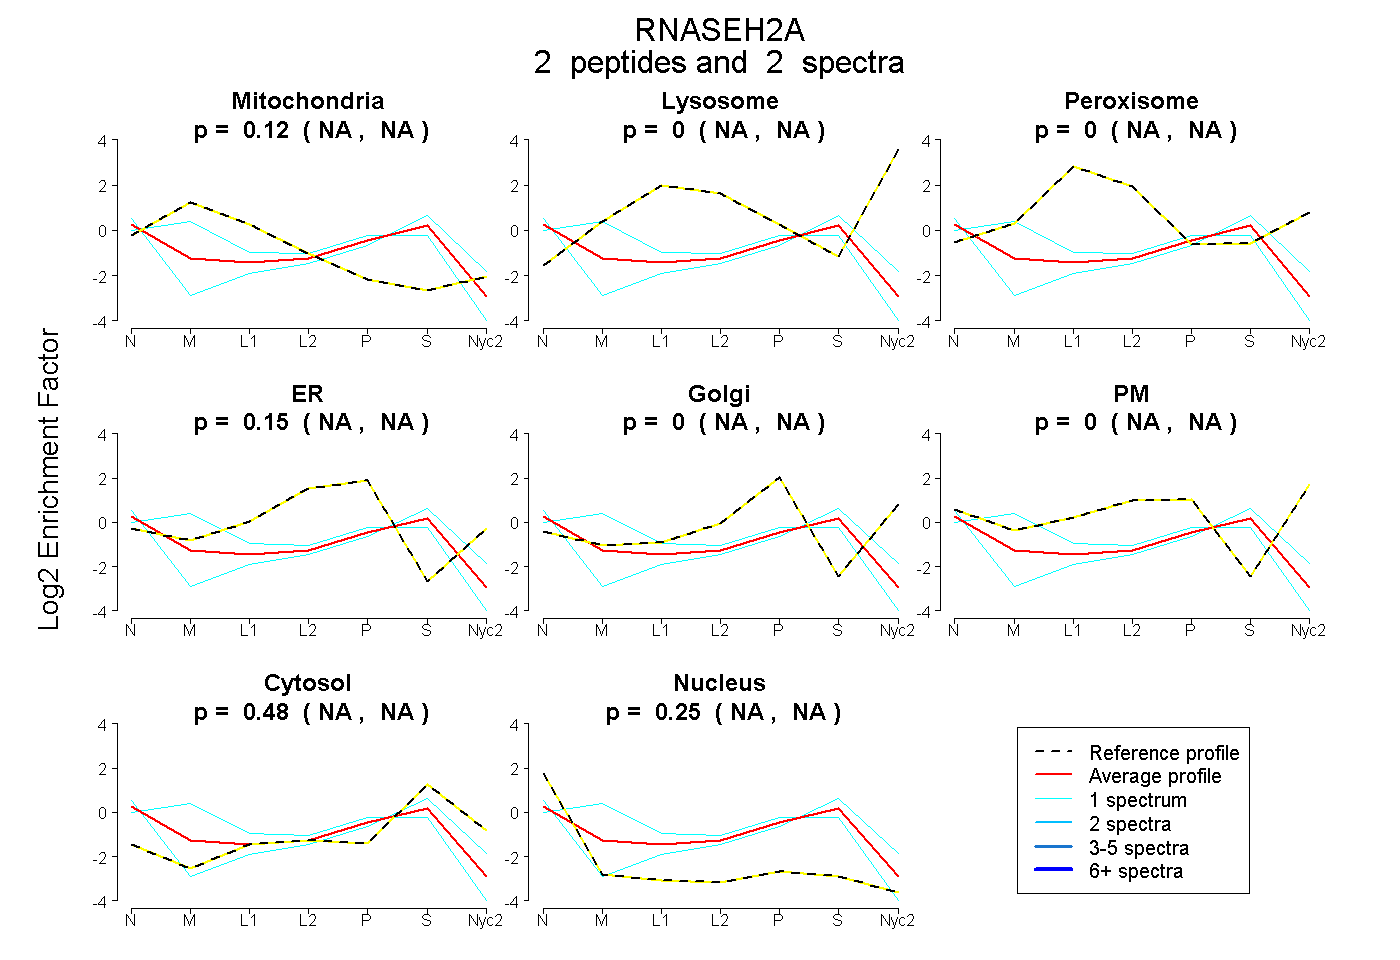
| Plot | Mito | Lyso | Perox | ER | Golgi | PM | Cytosol | Nucleus | |||||
| Expt A |
2 peptides |
2 spectra |
|
0.122 NA | NA |
0.000 NA | NA |
0.000 NA | NA |
0.147 NA | NA |
0.000 NA | NA |
0.000 NA | NA |
0.482 NA | NA |
0.249 NA | NA |
| 1 spectrum, ADSLFPVVSAASIIAK | 0.485 | 0.000 | 0.000 | 0.095 | 0.000 | 0.000 | 0.285 | 0.136 | ||
| 1 spectrum, EPCVLGVDEAGR | 0.000 | 0.000 | 0.000 | 0.077 | 0.000 | 0.000 | 0.657 | 0.267 |