 1
1peptide
spectra
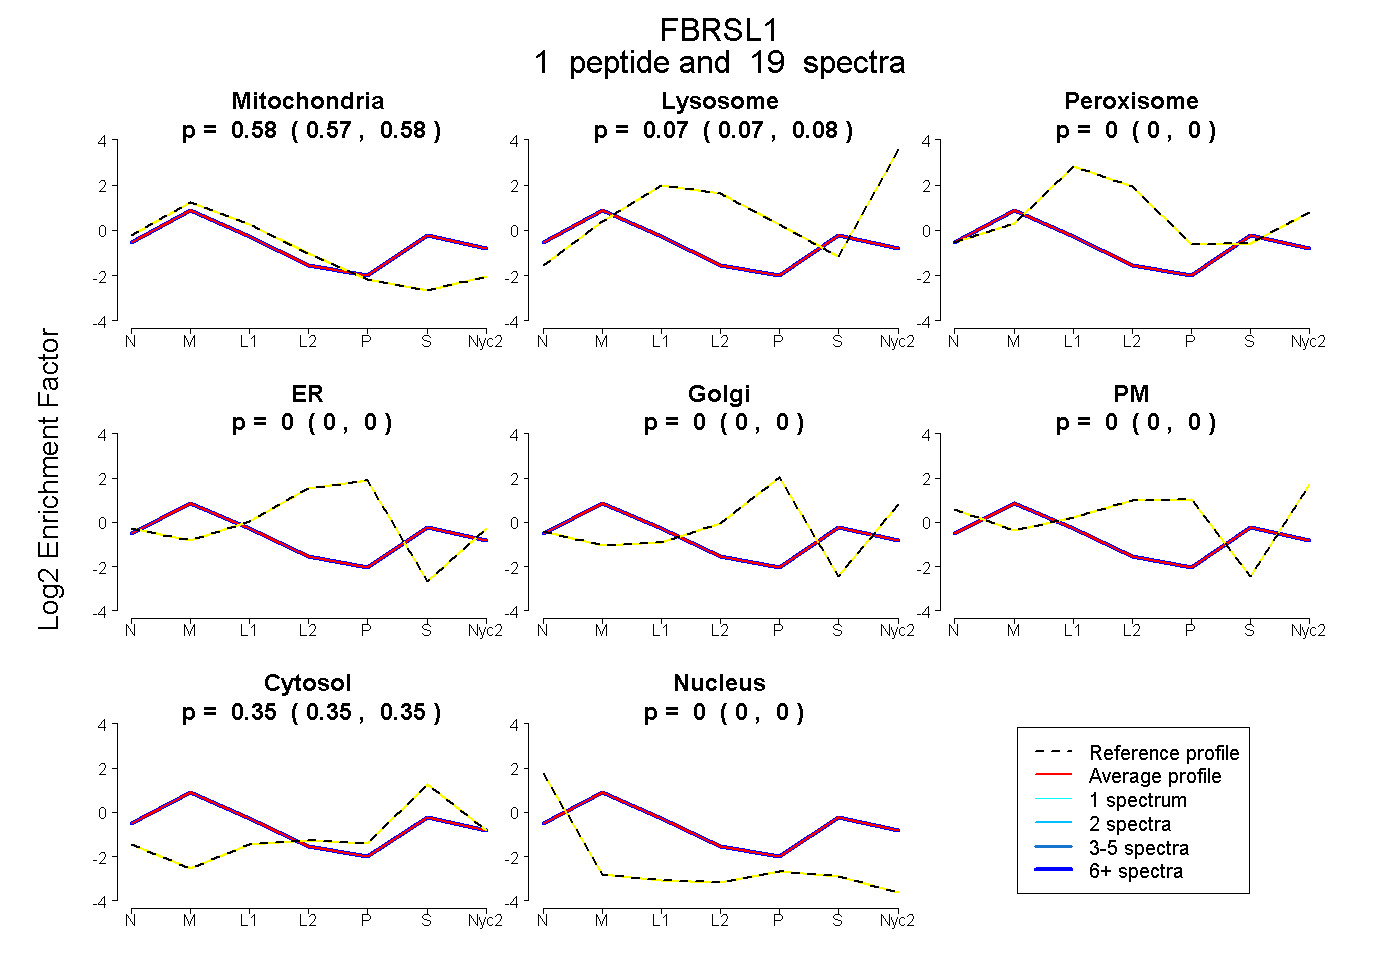
0.572 | 0.582
0.065 | 0.075
0.000 | 0.000
0.000 | 0.000
0.000 | 0.000
0.000 | 0.000
0.349 | 0.354
0.000 | 0.000
1peptide
spectra
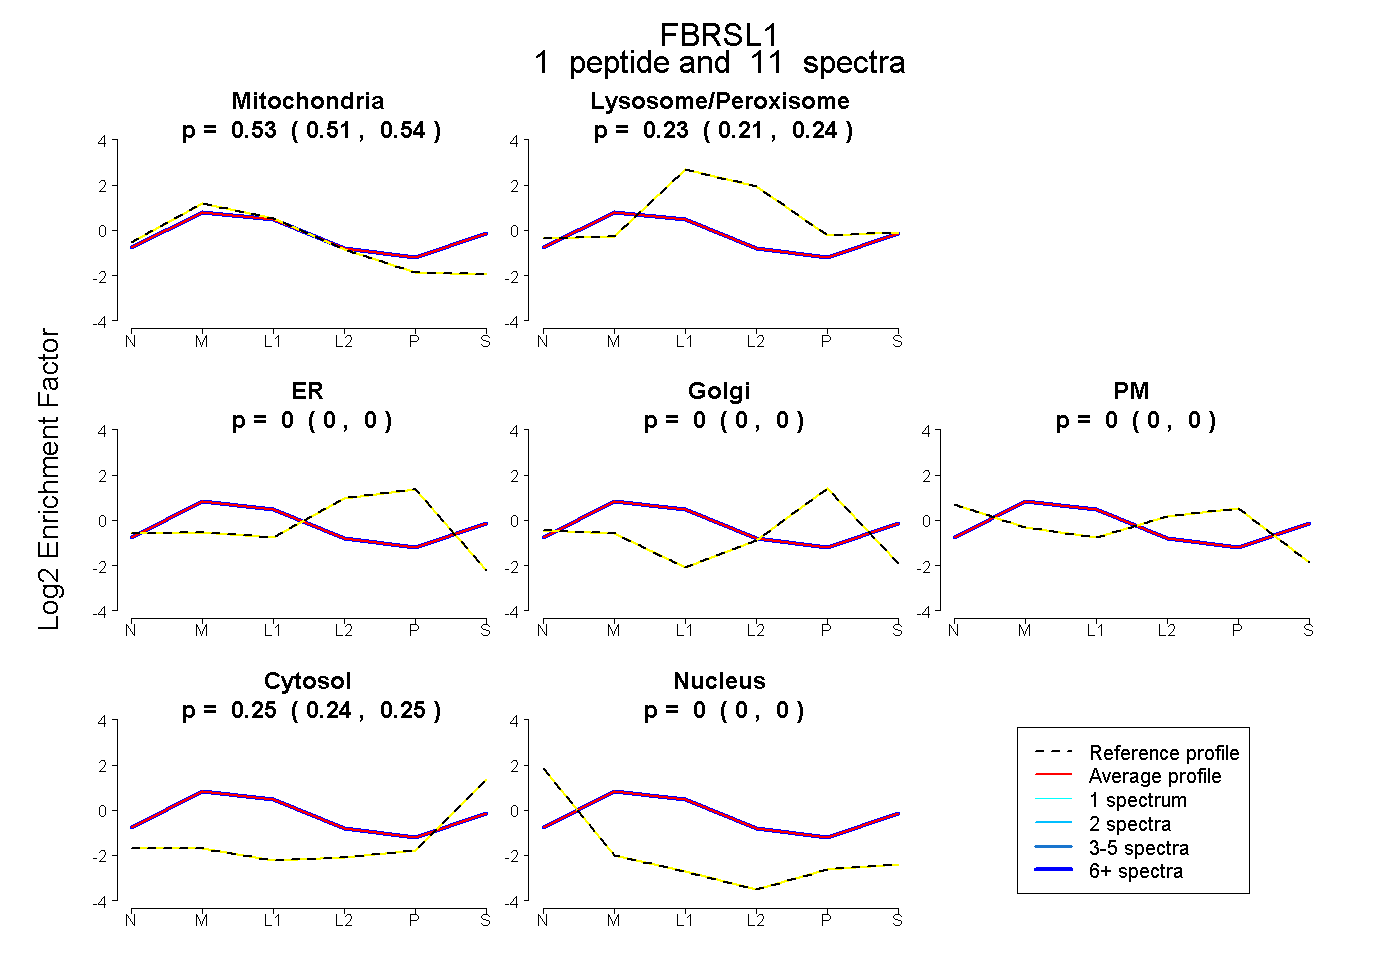
0.511 | 0.538
0.213 | 0.241
0.000 | 0.000
0.000 | 0.000
0.000 | 0.000
0.238 | 0.254
0.000 | 0.000
1peptide
spectra
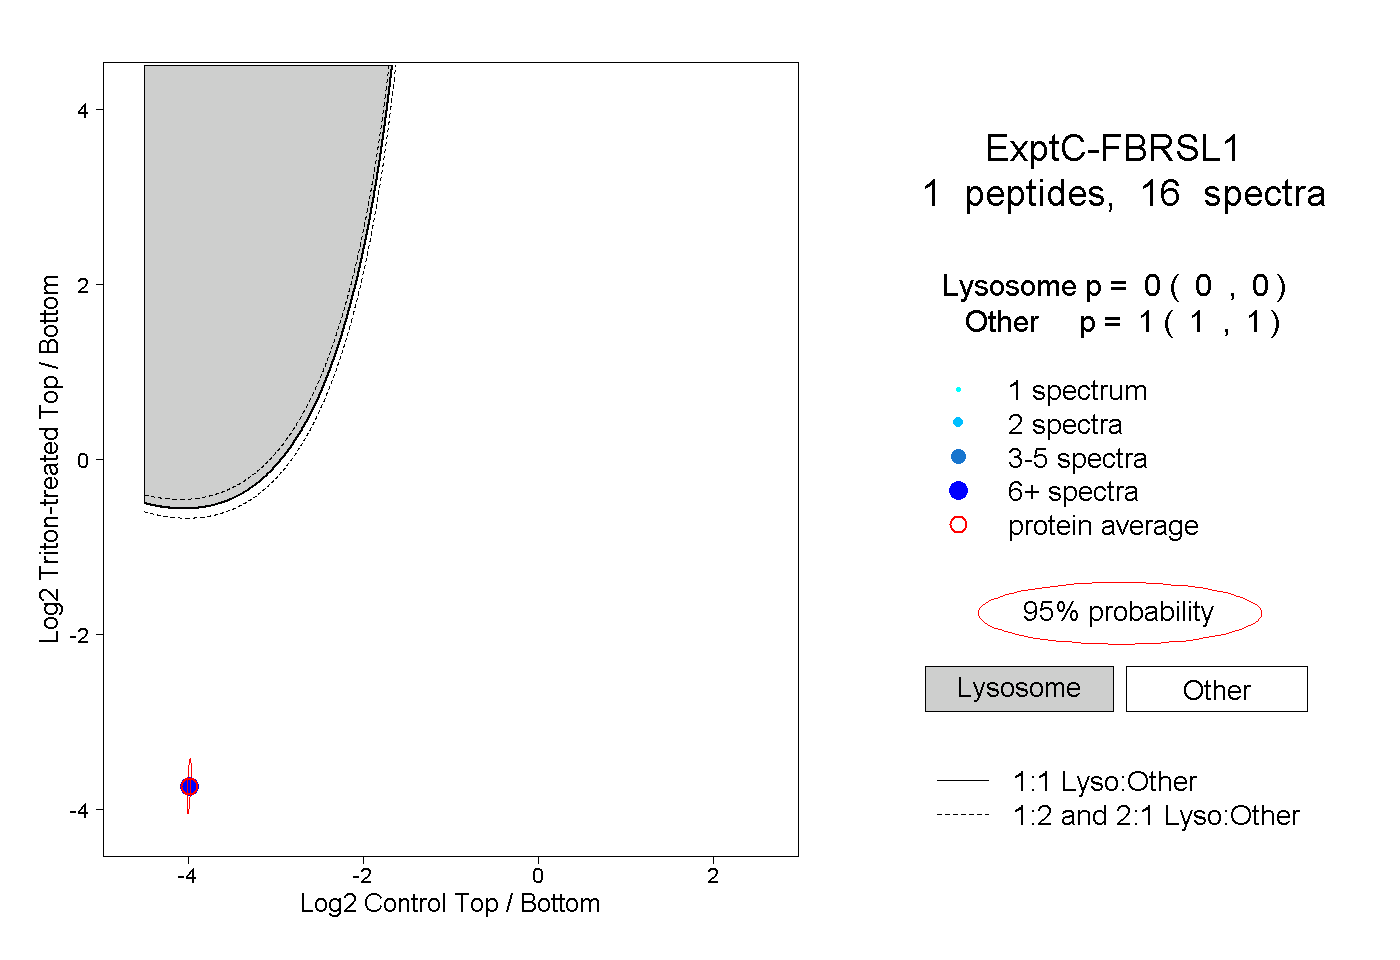
0.000 | 0.000
1.000 | 1.000