 73
73peptides
spectra
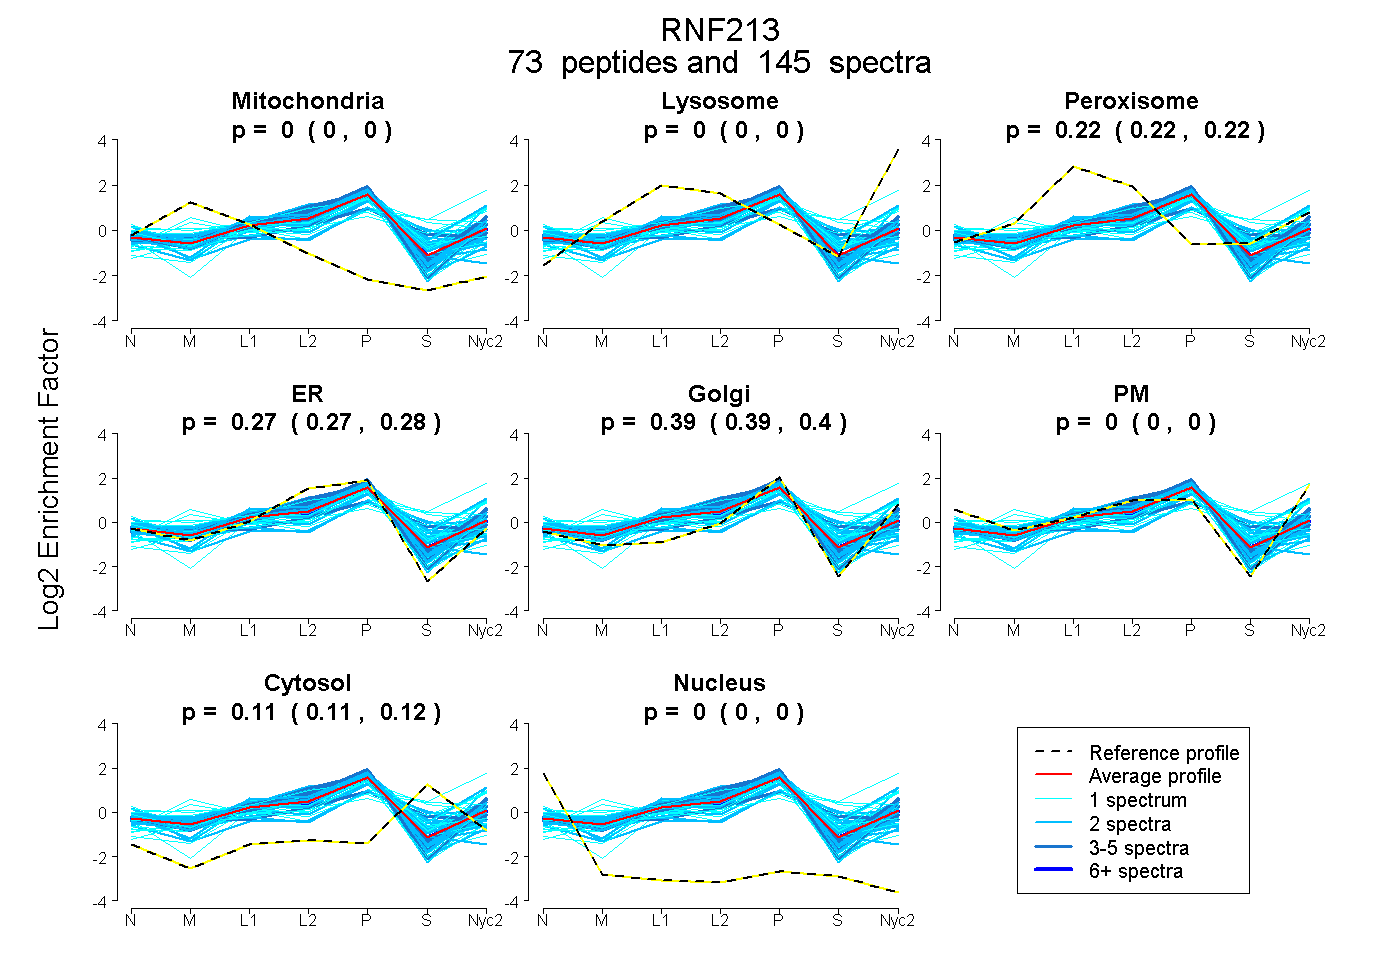
0.000 | 0.000
0.000 | 0.000
0.216 | 0.219
0.269 | 0.279
0.389 | 0.398
0.000 | 0.000
0.112 | 0.115
0.000 | 0.000
20peptides
spectra
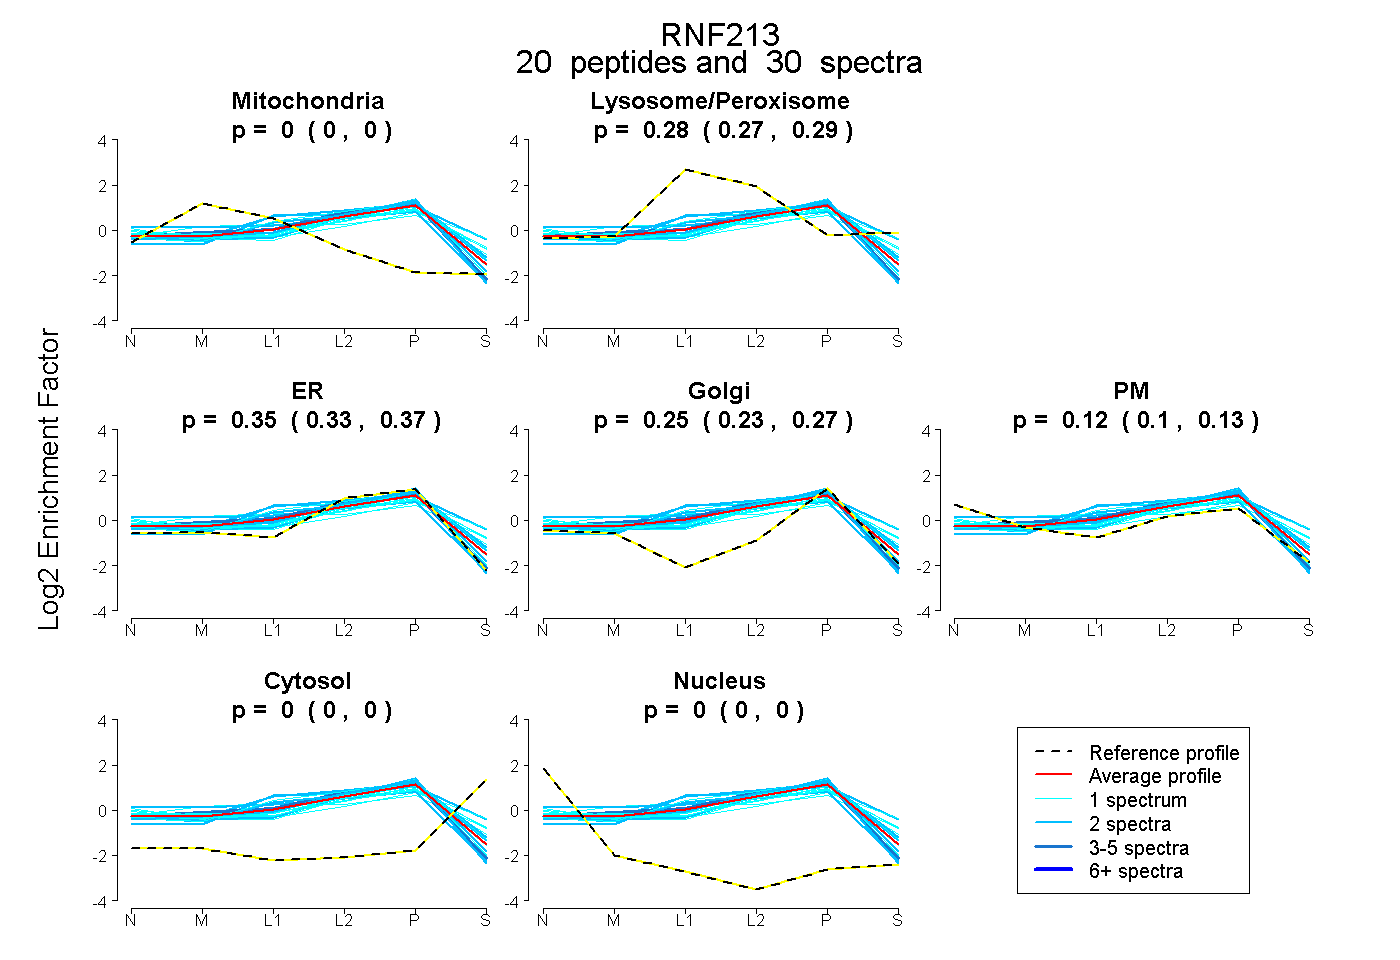
0.000 | 0.000
0.269 | 0.294
0.326 | 0.369
0.228 | 0.270
0.101 | 0.131
0.000 | 0.000
0.000 | 0.000
110peptides
spectra
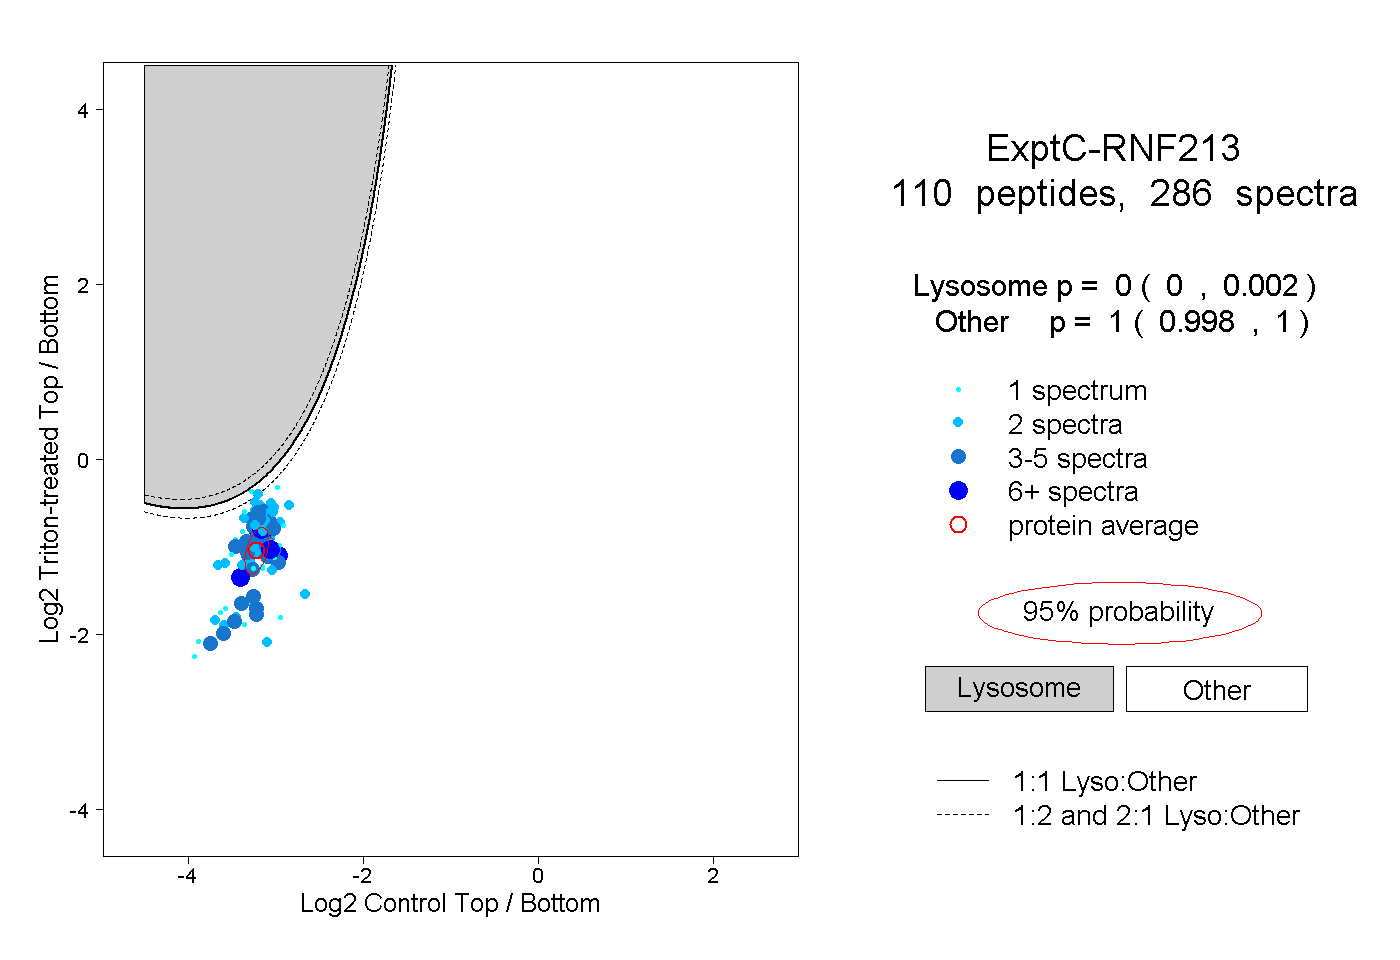
0.000 | 0.002
0.998 | 1.000
14peptides
spectra
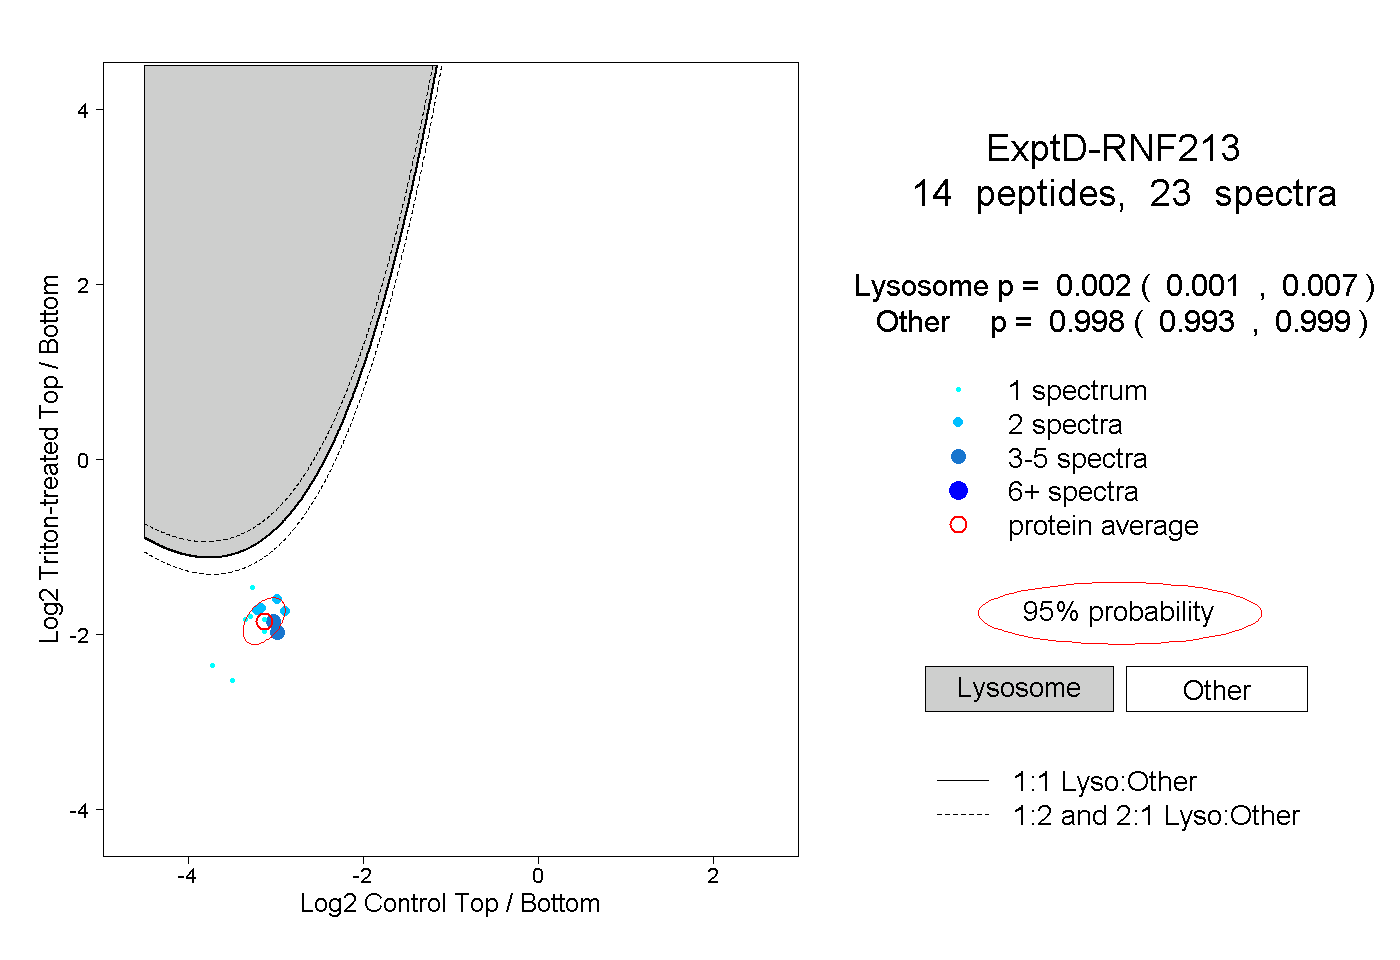
0.001 | 0.007
0.993 | 0.999