 1
1peptide
spectrum
NA | NA
NA | NA
NA | NA
NA | NA
NA | NA
NA | NA
NA | NA
NA | NA
1peptide
spectra
0.000 | 0.000
1.000 | 1.000
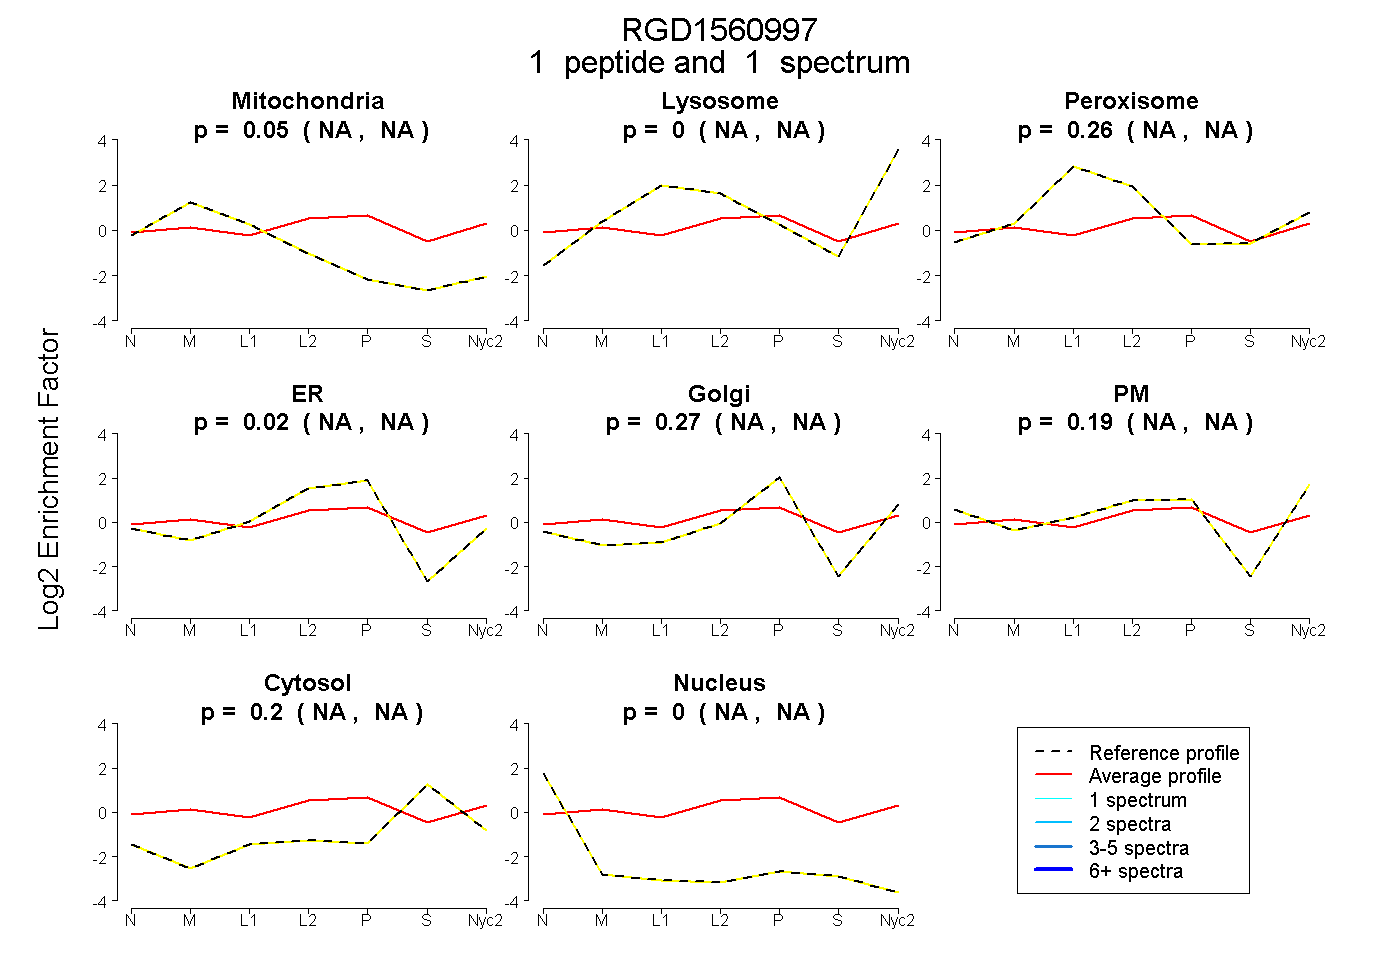
| Plot | Mito | Lyso | Perox | ER | Golgi | PM | Cytosol | Nucleus | |||||
| Expt A |
1 peptide |
1 spectrum |
|
0.054 NA | NA |
0.000 NA | NA |
0.257 NA | NA |
0.022 NA | NA |
0.272 NA | NA |
0.191 NA | NA |
0.204 NA | NA |
0.000 NA | NA |
||
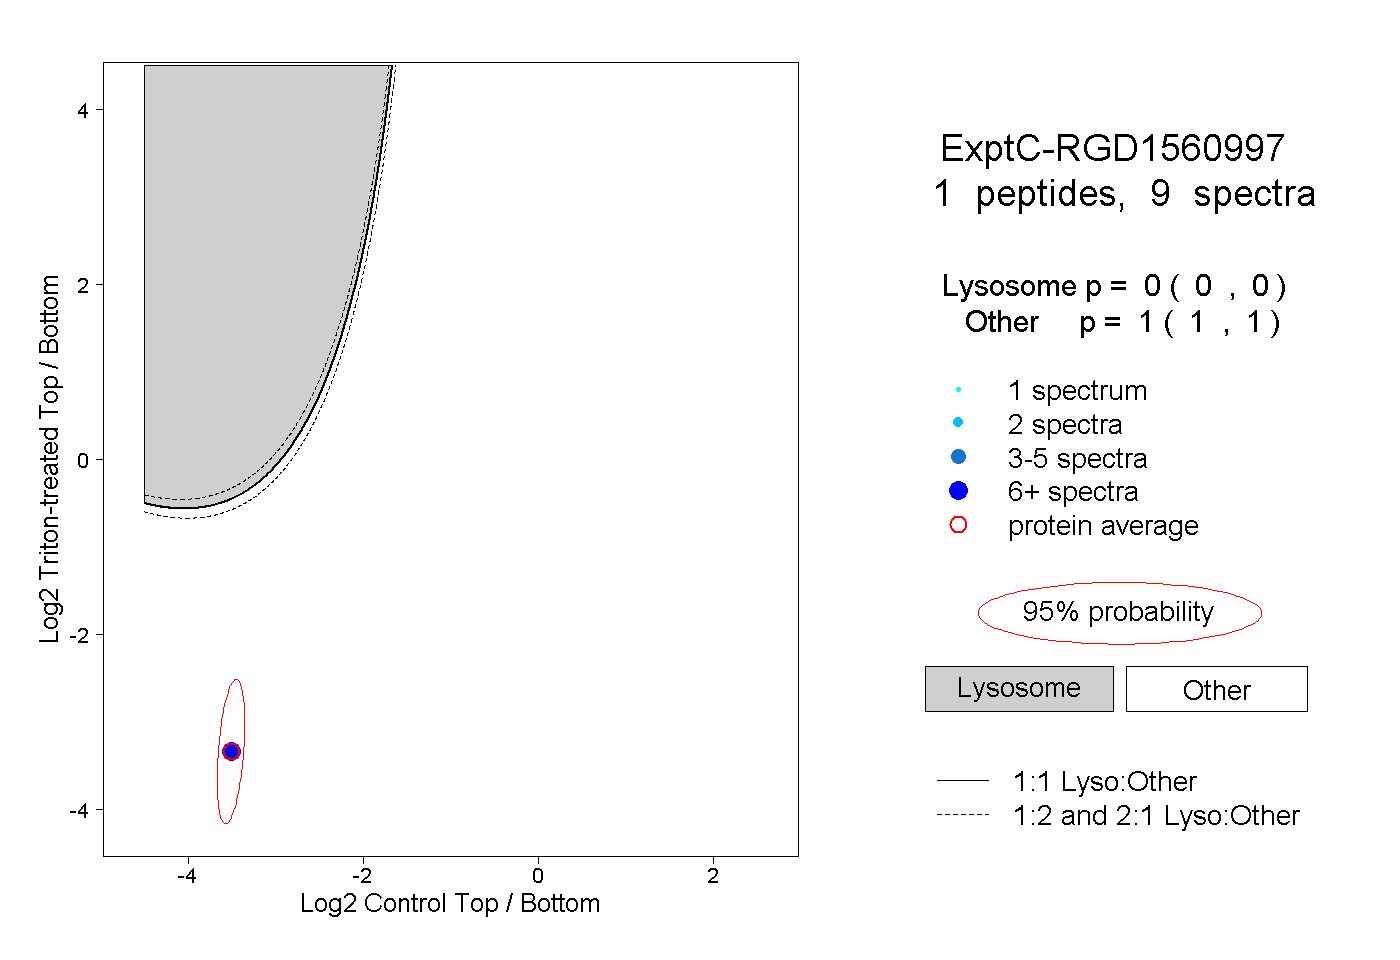
| Plot | Lyso | Other | |||||||||||
| Expt C |
1 peptide |
9 spectra |
|
0.000 0.000 | 0.000 |
1.000 1.000 | 1.000 |