 2
2peptides
spectra
0.000 | 0.041
0.000 | 0.000
0.000 | 0.021
0.000 | 0.197
0.191 | 0.460
0.000 | 0.000
0.439 | 0.474
0.056 | 0.132
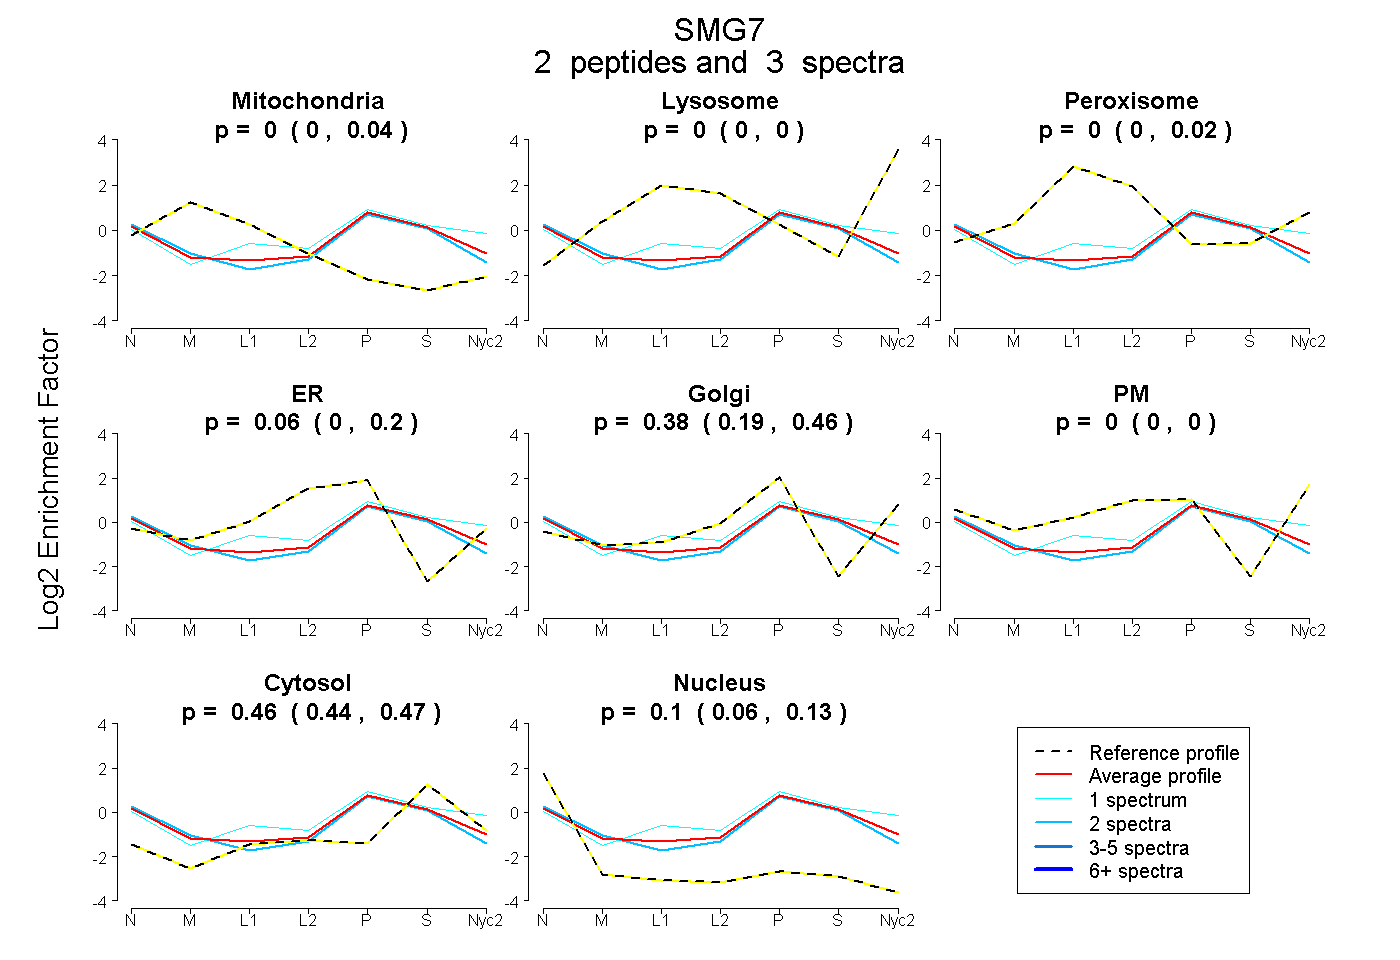
| Plot | Mito | Lyso | Perox | ER | Golgi | PM | Cytosol | Nucleus | |||||
| Expt A |
2 peptides |
3 spectra |
|
0.003 0.000 | 0.041 |
0.000 0.000 | 0.000 |
0.000 0.000 | 0.021 |
0.062 0.000 | 0.197 |
0.378 0.191 | 0.460 |
0.000 0.000 | 0.000 |
0.461 0.439 | 0.474 |
0.097 0.056 | 0.132 |
| 1 spectrum, SVLSTGR | 0.000 | 0.000 | 0.062 | 0.000 | 0.420 | 0.047 | 0.471 | 0.000 | ||
| 2 spectra, NQTSQAESYYR | 0.013 | 0.000 | 0.000 | 0.046 | 0.352 | 0.000 | 0.431 | 0.158 |