 6
6peptides
spectra
0.000 | 0.000
0.019 | 0.066
0.121 | 0.170
0.000 | 0.000
0.164 | 0.190
0.000 | 0.000
0.615 | 0.640
0.000 | 0.000
| Plot | Mito | Lyso | Perox | ER | Golgi | PM | Cytosol | Nucleus | |||||
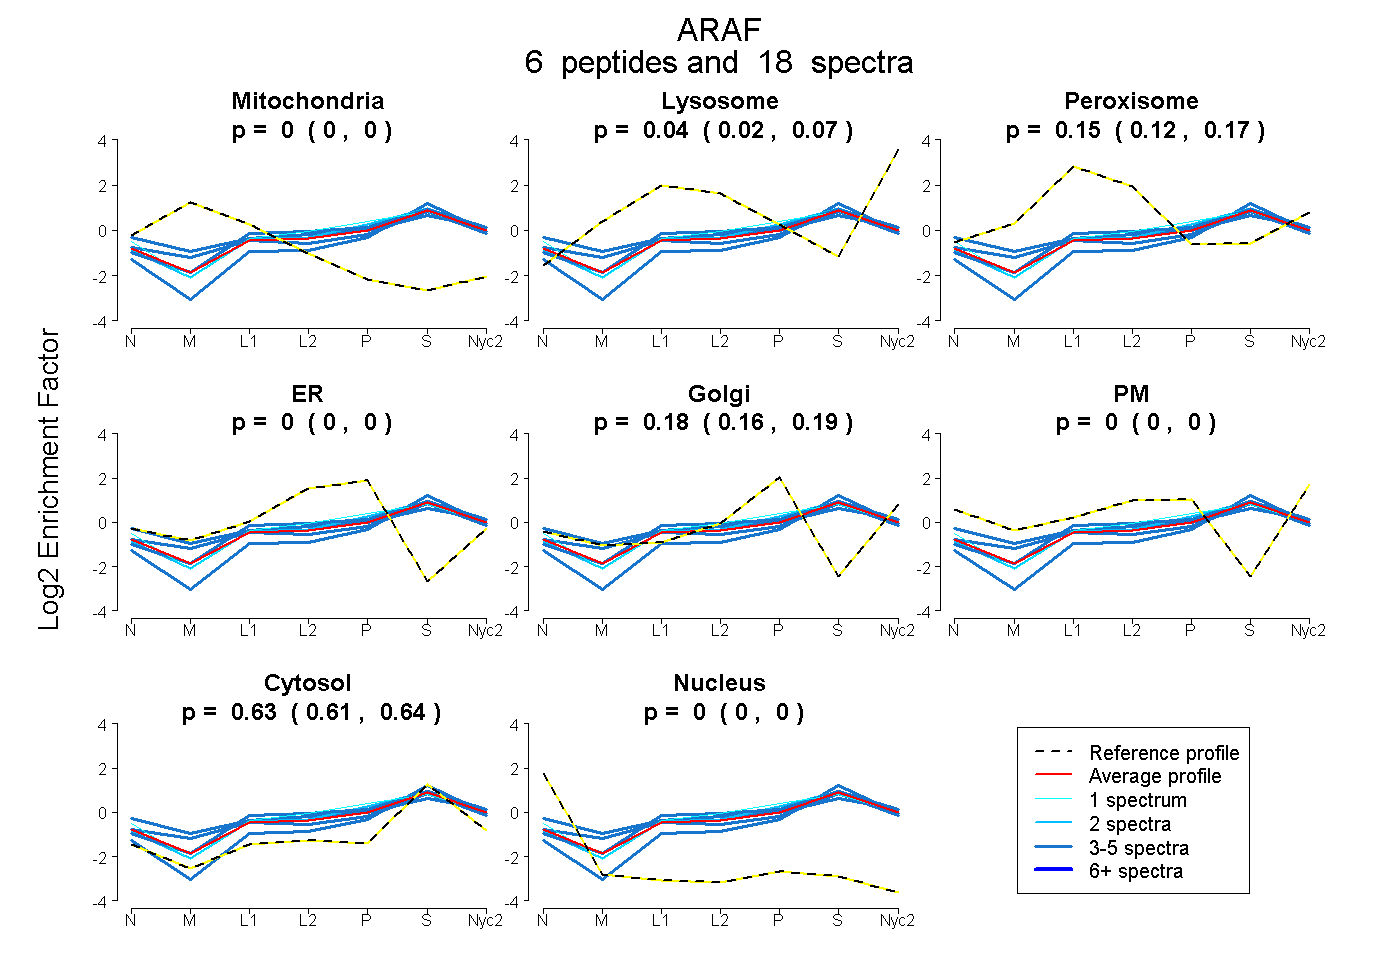
| Expt A |
6 peptides |
18 spectra |
|
0.000 0.000 | 0.000 |
0.044 0.019 | 0.066 |
0.149 0.121 | 0.170 |
0.000 0.000 | 0.000 |
0.180 0.164 | 0.190 |
0.000 0.000 | 0.000 |
0.628 0.615 | 0.640 |
0.000 0.000 | 0.000 |
| 2 spectra, TVVTVR | 0.000 | 0.078 | 0.096 | 0.033 | 0.165 | 0.000 | 0.629 | 0.000 | ||
| 4 spectra, FLFHGFR | 0.000 | 0.058 | 0.000 | 0.000 | 0.107 | 0.000 | 0.835 | 0.000 | ||
| 4 spectra, DGMSVYDSLDK | 0.000 | 0.002 | 0.222 | 0.000 | 0.168 | 0.000 | 0.608 | 0.000 | ||
| 3 spectra, VPTVCVDMSTNR | 0.000 | 0.136 | 0.110 | 0.114 | 0.024 | 0.000 | 0.616 | 0.000 | ||
| 4 spectra, QFYHSIQDLSGGSR | 0.000 | 0.000 | 0.186 | 0.000 | 0.041 | 0.238 | 0.535 | 0.000 | ||
| 1 spectrum, VYLPNK | 0.000 | 0.000 | 0.152 | 0.085 | 0.161 | 0.024 | 0.579 | 0.000 |
| Plot | Mito | Lyso or Perox | ER | Golgi | PM | Cytosol | Nucleus | ||||||
| Expt B |
3 peptides |
4 spectra |
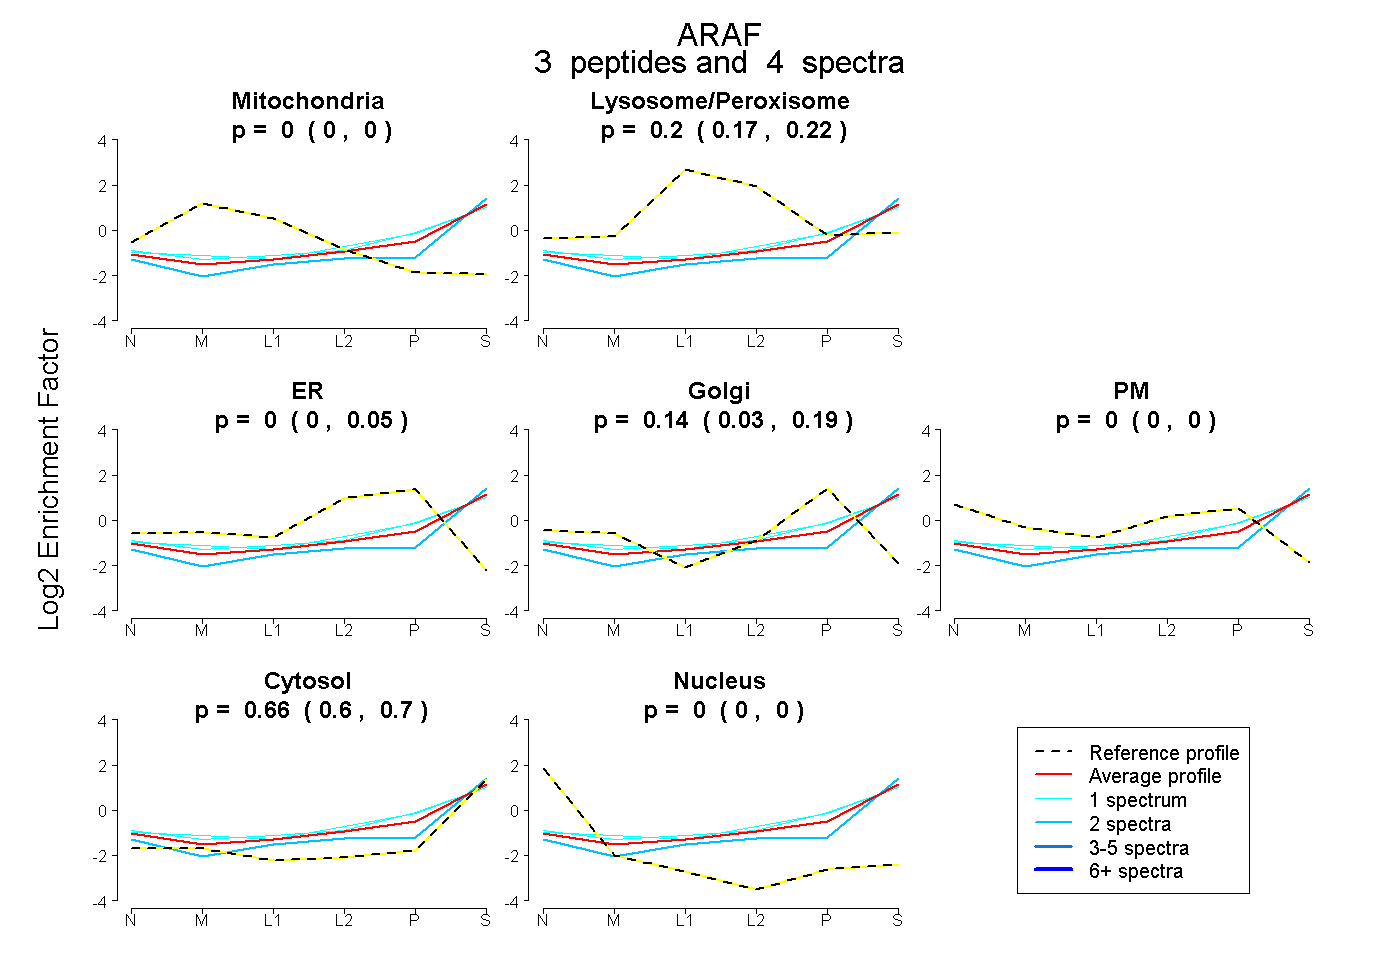 |
0.000 0.000 | 0.000 |
0.203 0.172 | 0.222 |
0.000 0.000 | 0.047 |
0.140 0.028 | 0.188 |
0.000 0.000 | 0.000 |
0.657 0.604 | 0.704 |
0.000 0.000 | 0.000 |
|||
| Plot | Lyso | Other | |||||||||||
| Expt C |
5 peptides |
23 spectra |
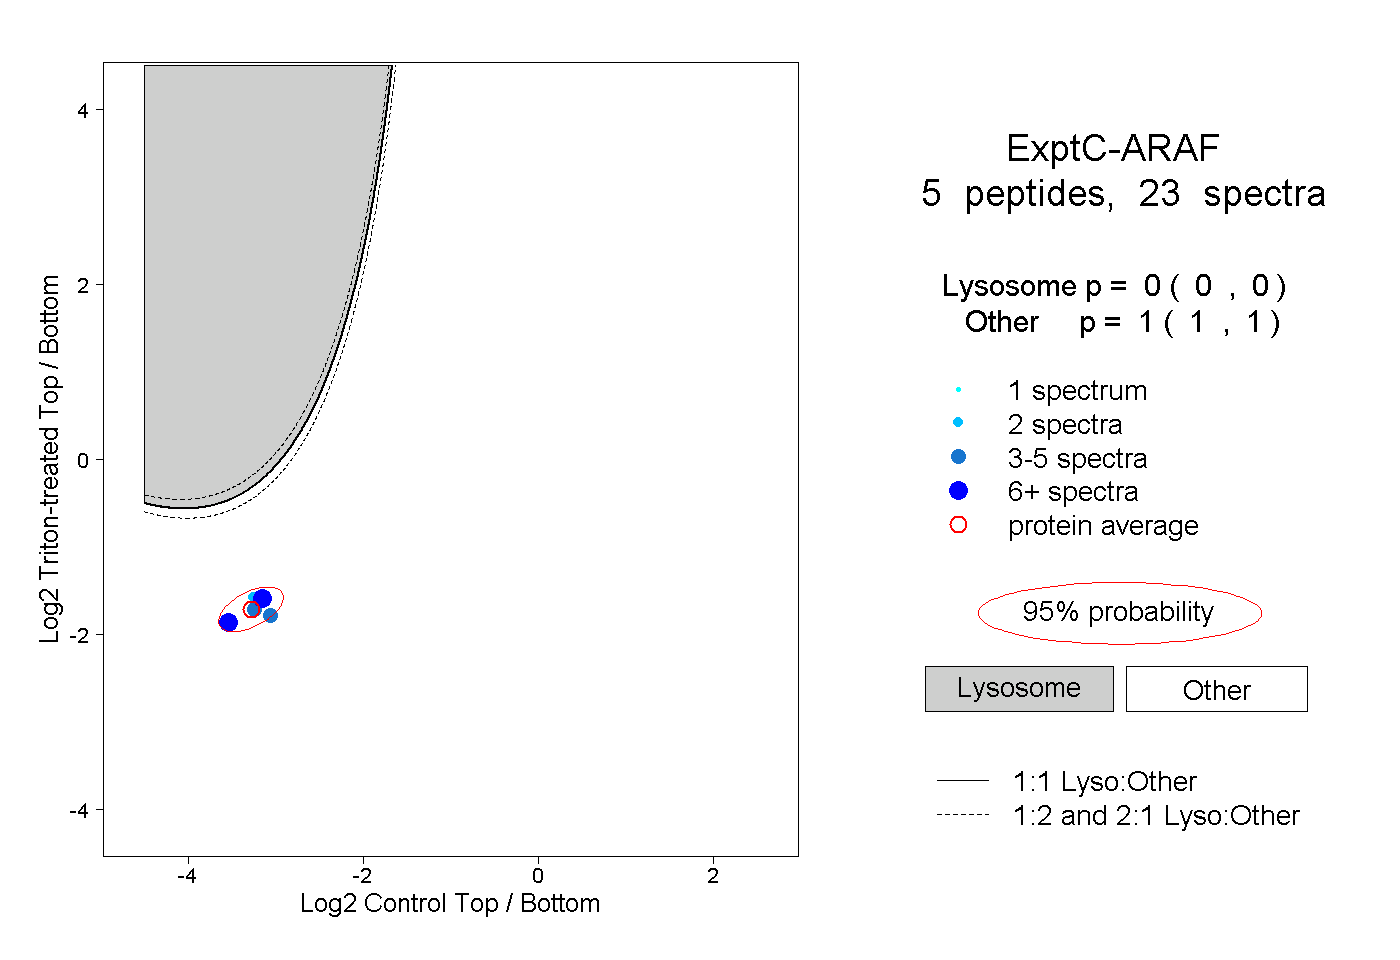 |
0.000 0.000 | 0.000 |
1.000 1.000 | 1.000 |