 2
2peptides
spectra
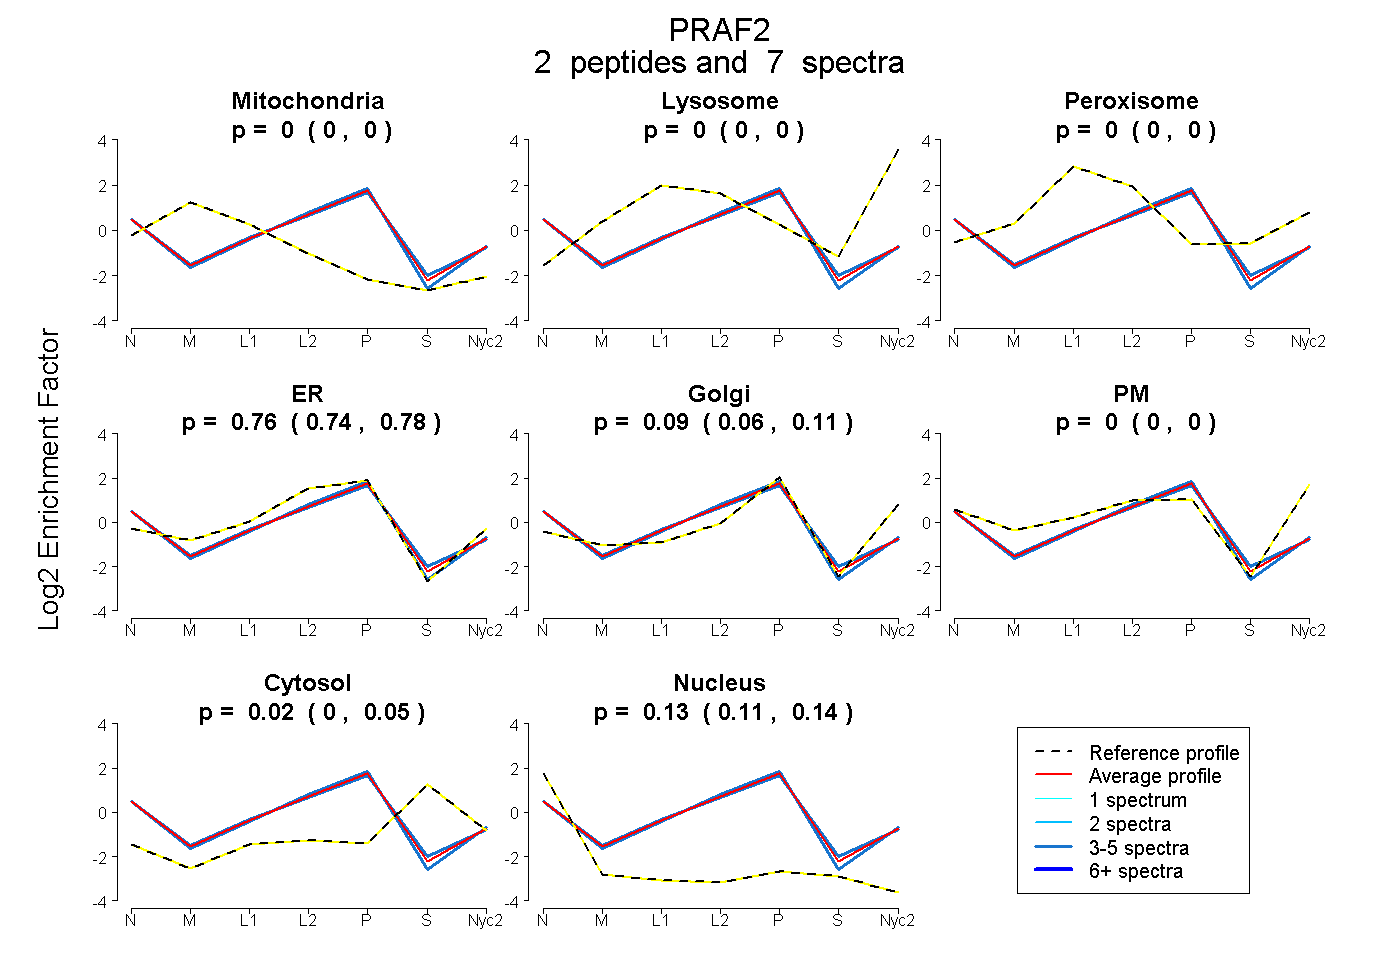
0.000 | 0.000
0.000 | 0.000
0.000 | 0.000
0.740 | 0.785
0.058 | 0.114
0.000 | 0.000
0.000 | 0.051
0.107 | 0.139
2peptides
spectra
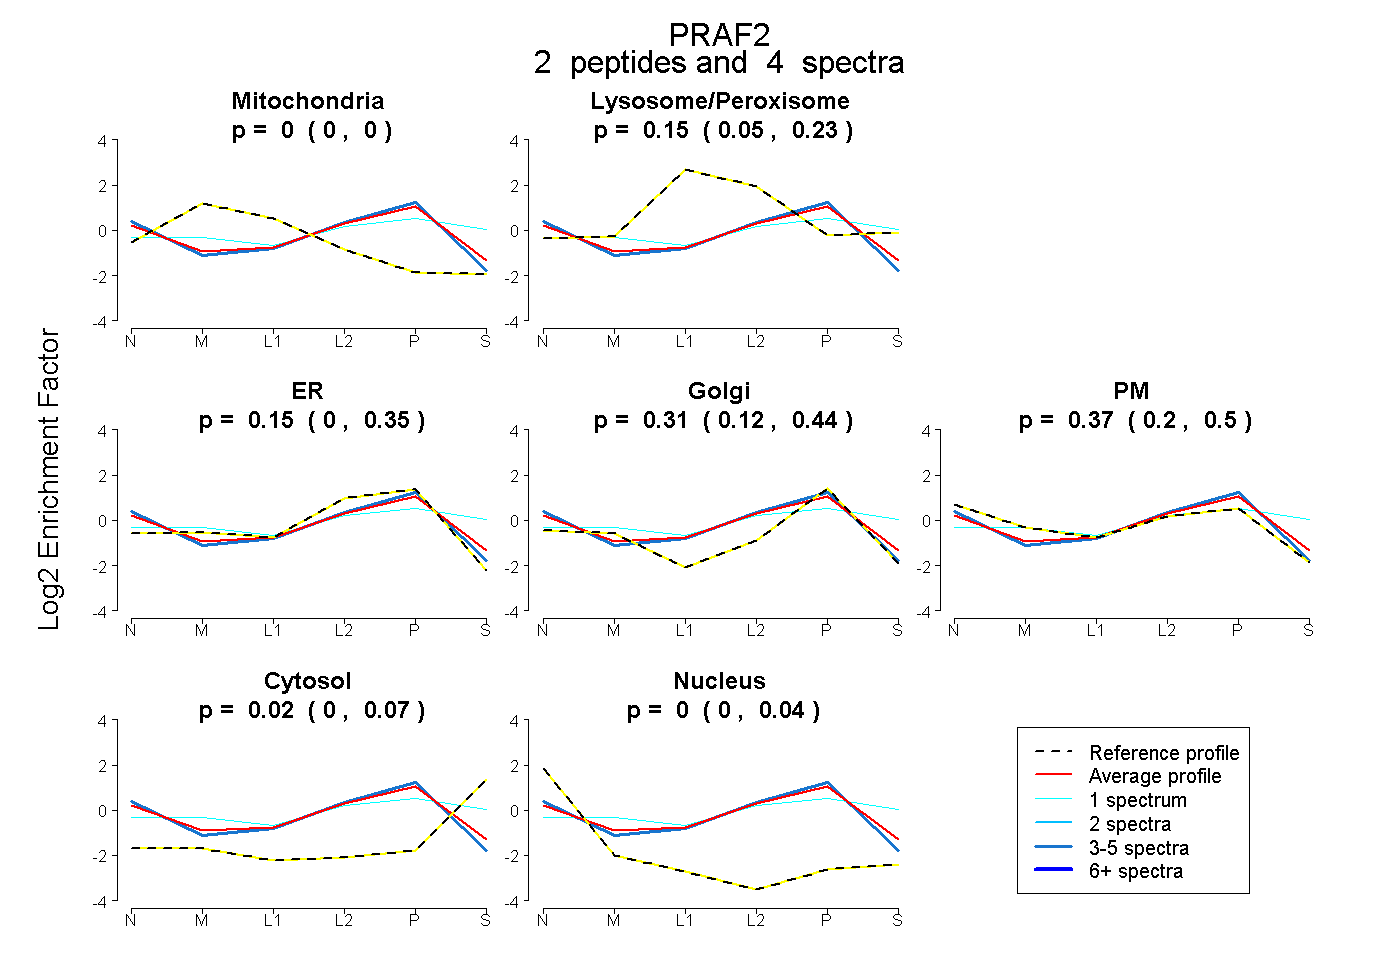
0.000 | 0.000
0.055 | 0.225
0.000 | 0.348
0.118 | 0.441
0.202 | 0.498
0.000 | 0.067
0.000 | 0.036
1peptide
spectra
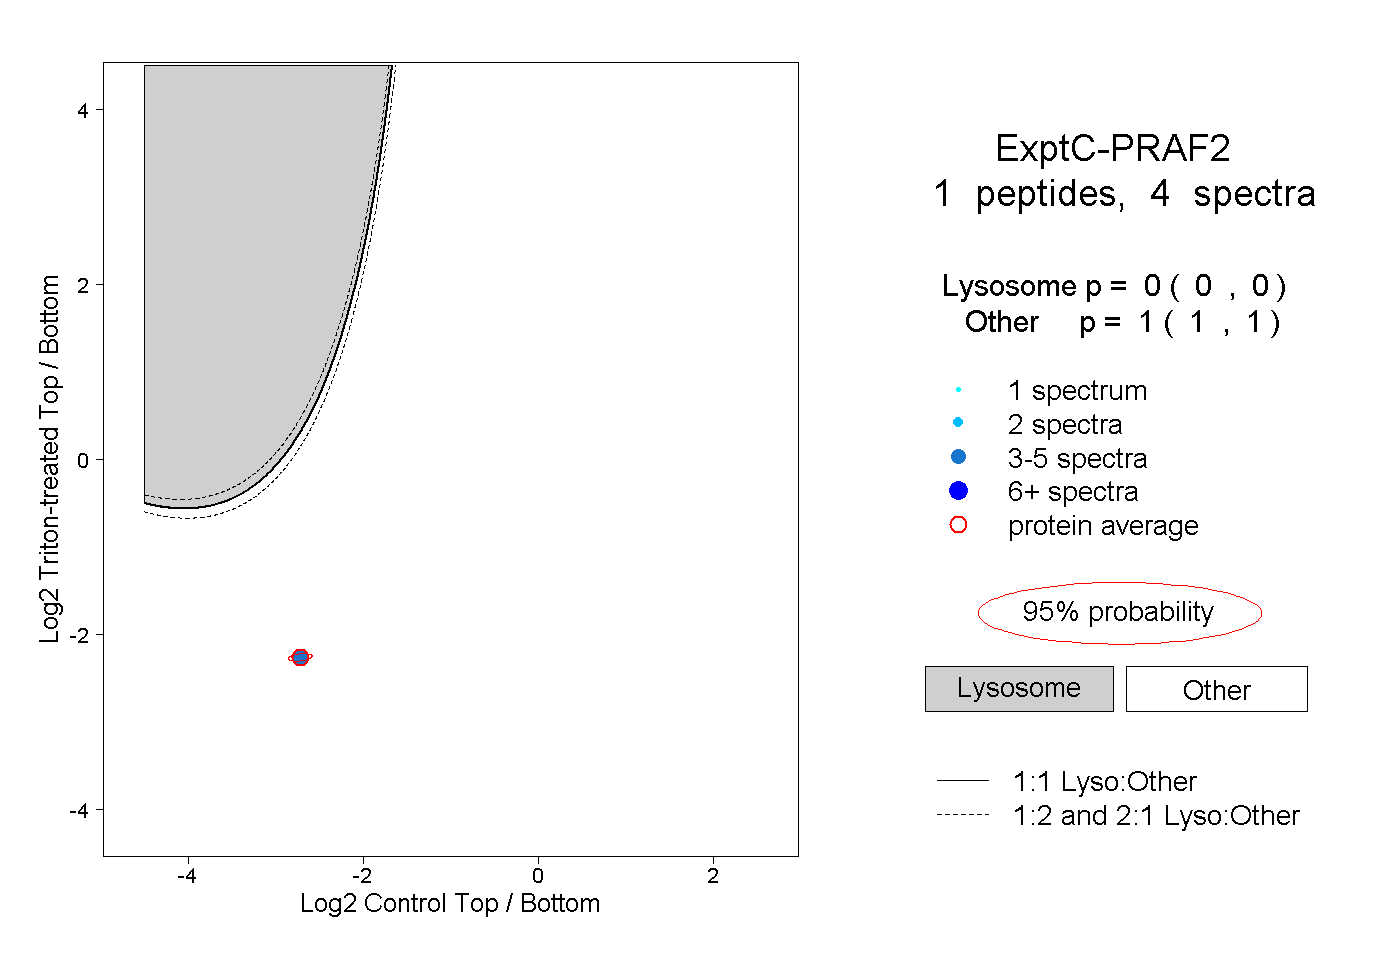
0.000 | 0.000
1.000 | 1.000
1peptide
spectra
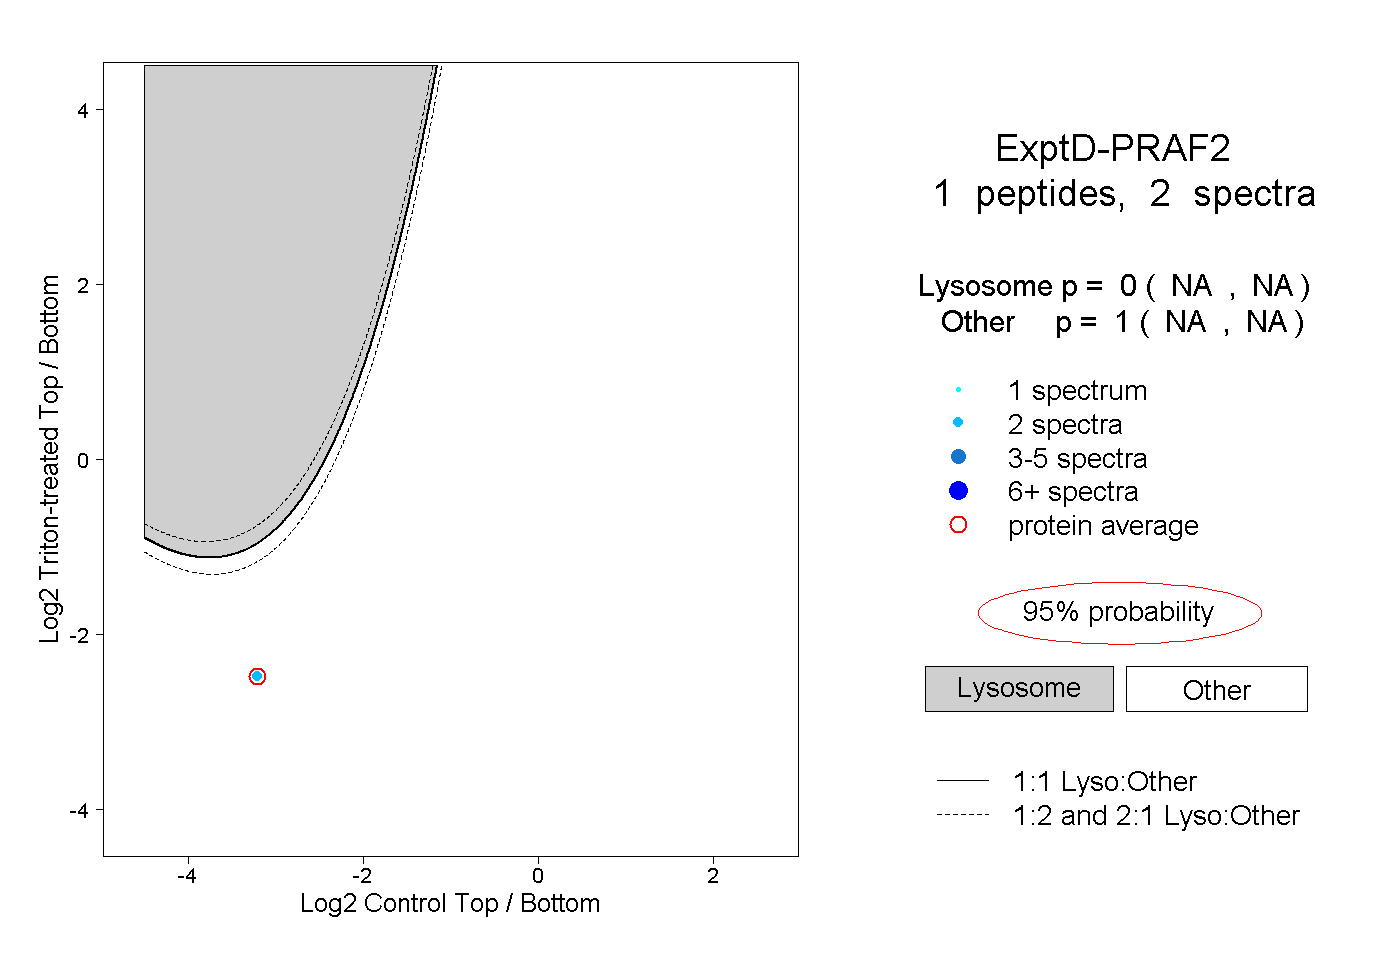
NA | NA
NA | NA