 19
19peptides
spectra
0.660 | 0.668
0.112 | 0.125
0.000 | 0.007
0.054 | 0.072
0.000 | 0.000
0.138 | 0.161
0.000 | 0.000
0.000 | 0.000
| Plot | Mito | Lyso | Perox | ER | Golgi | PM | Cytosol | Nucleus | |||||
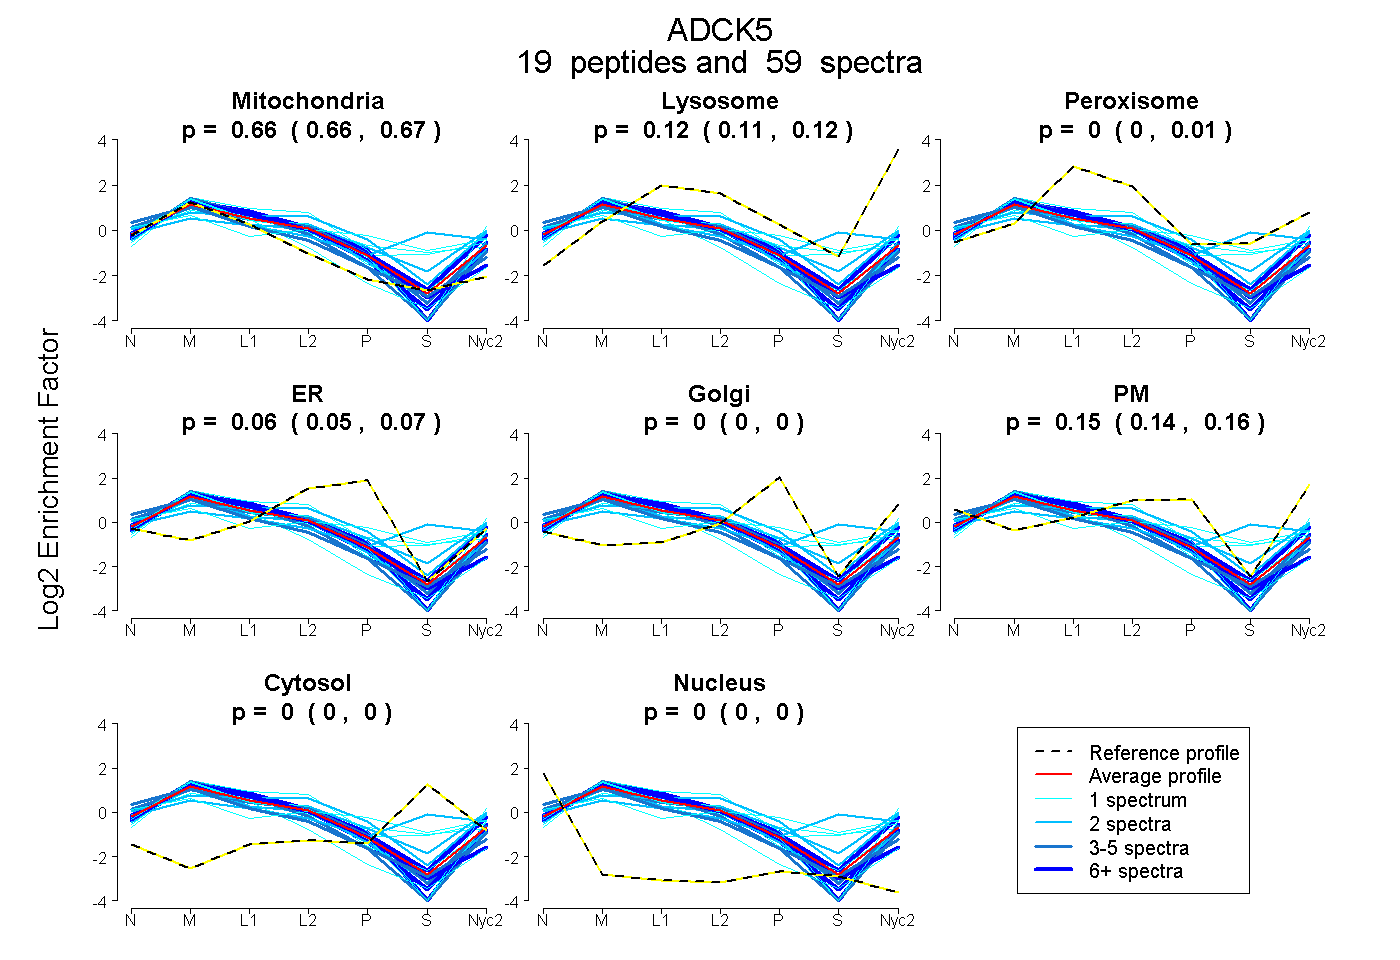
| Expt A |
19 peptides |
59 spectra |
|
0.665 0.660 | 0.668 |
0.120 0.112 | 0.125 |
0.000 0.000 | 0.007 |
0.065 0.054 | 0.072 |
0.000 0.000 | 0.000 |
0.151 0.138 | 0.161 |
0.000 0.000 | 0.000 |
0.000 0.000 | 0.000 |
| 4 spectra, YFLMAK | 0.776 | 0.000 | 0.000 | 0.000 | 0.000 | 0.215 | 0.000 | 0.009 | ||
| 4 spectra, LVGAAYQGIYSSR | 0.781 | 0.060 | 0.000 | 0.000 | 0.000 | 0.159 | 0.000 | 0.000 | ||
| 1 spectrum, YVEIMSACHQR | 0.342 | 0.000 | 0.105 | 0.015 | 0.035 | 0.312 | 0.191 | 0.000 | ||
| 1 spectrum, VQYIDLR | 0.970 | 0.022 | 0.000 | 0.000 | 0.000 | 0.008 | 0.000 | 0.000 | ||
| 2 spectra, FTALMLR | 0.676 | 0.021 | 0.000 | 0.190 | 0.000 | 0.112 | 0.000 | 0.000 | ||
| 7 spectra, GTLAQELDFENEGR | 0.627 | 0.046 | 0.000 | 0.052 | 0.000 | 0.274 | 0.000 | 0.000 | ||
| 1 spectrum, HFHHVVIPR | 0.534 | 0.267 | 0.000 | 0.121 | 0.000 | 0.078 | 0.000 | 0.000 | ||
| 1 spectrum, EHFDGIMEVLK | 0.504 | 0.088 | 0.264 | 0.000 | 0.000 | 0.034 | 0.110 | 0.000 | ||
| 2 spectra, SQGLAVQDVATK | 0.407 | 0.022 | 0.148 | 0.089 | 0.000 | 0.333 | 0.000 | 0.000 | ||
| 10 spectra, EEAAYMQDMAR | 0.619 | 0.233 | 0.000 | 0.019 | 0.000 | 0.129 | 0.000 | 0.000 | ||
| 2 spectra, SAVWGWSR | 0.336 | 0.023 | 0.278 | 0.000 | 0.000 | 0.052 | 0.310 | 0.000 | ||
| 2 spectra, FDGDVHTLELLLR | 0.505 | 0.155 | 0.093 | 0.000 | 0.000 | 0.247 | 0.000 | 0.000 | ||
| 6 spectra, AINSSLGTPVDR | 0.717 | 0.101 | 0.000 | 0.057 | 0.000 | 0.125 | 0.000 | 0.000 | ||
| 2 spectra, LEILAMR | 0.726 | 0.098 | 0.000 | 0.074 | 0.000 | 0.101 | 0.000 | 0.000 | ||
| 6 spectra, SSLCQLWR | 0.723 | 0.000 | 0.082 | 0.195 | 0.000 | 0.000 | 0.000 | 0.000 | ||
| 1 spectrum, LAVDGIGR | 0.718 | 0.213 | 0.011 | 0.058 | 0.000 | 0.000 | 0.000 | 0.000 | ||
| 1 spectrum, CAQELK | 0.431 | 0.000 | 0.348 | 0.004 | 0.115 | 0.010 | 0.092 | 0.000 | ||
| 1 spectrum, VIWEALK | 0.662 | 0.058 | 0.000 | 0.000 | 0.000 | 0.280 | 0.000 | 0.000 | ||
| 5 spectra, LGQLWGSHLISR | 0.625 | 0.001 | 0.007 | 0.011 | 0.000 | 0.356 | 0.000 | 0.000 |
| Plot | Mito | Lyso or Perox | ER | Golgi | PM | Cytosol | Nucleus | ||||||
| Expt B |
6 peptides |
12 spectra |
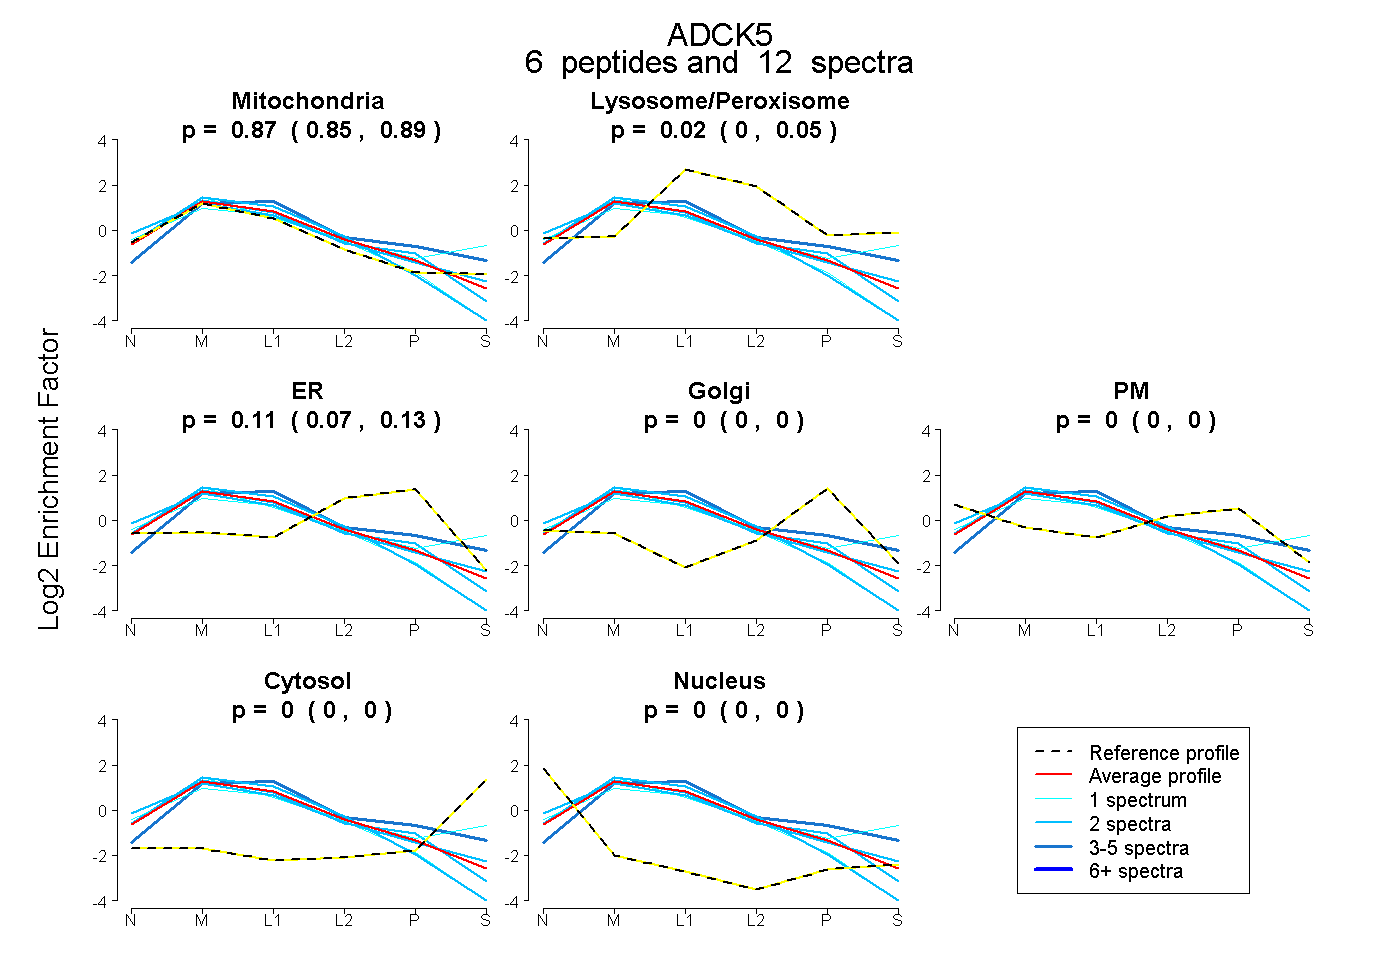 |
0.874 0.848 | 0.894 |
0.020 0.000 | 0.054 |
0.106 0.072 | 0.131 |
0.000 0.000 | 0.000 |
0.000 0.000 | 0.000 |
0.000 0.000 | 0.000 |
0.000 0.000 | 0.000 |
|||
| Plot | Lyso | Other | |||||||||||
| Expt C |
26 peptides |
157 spectra |
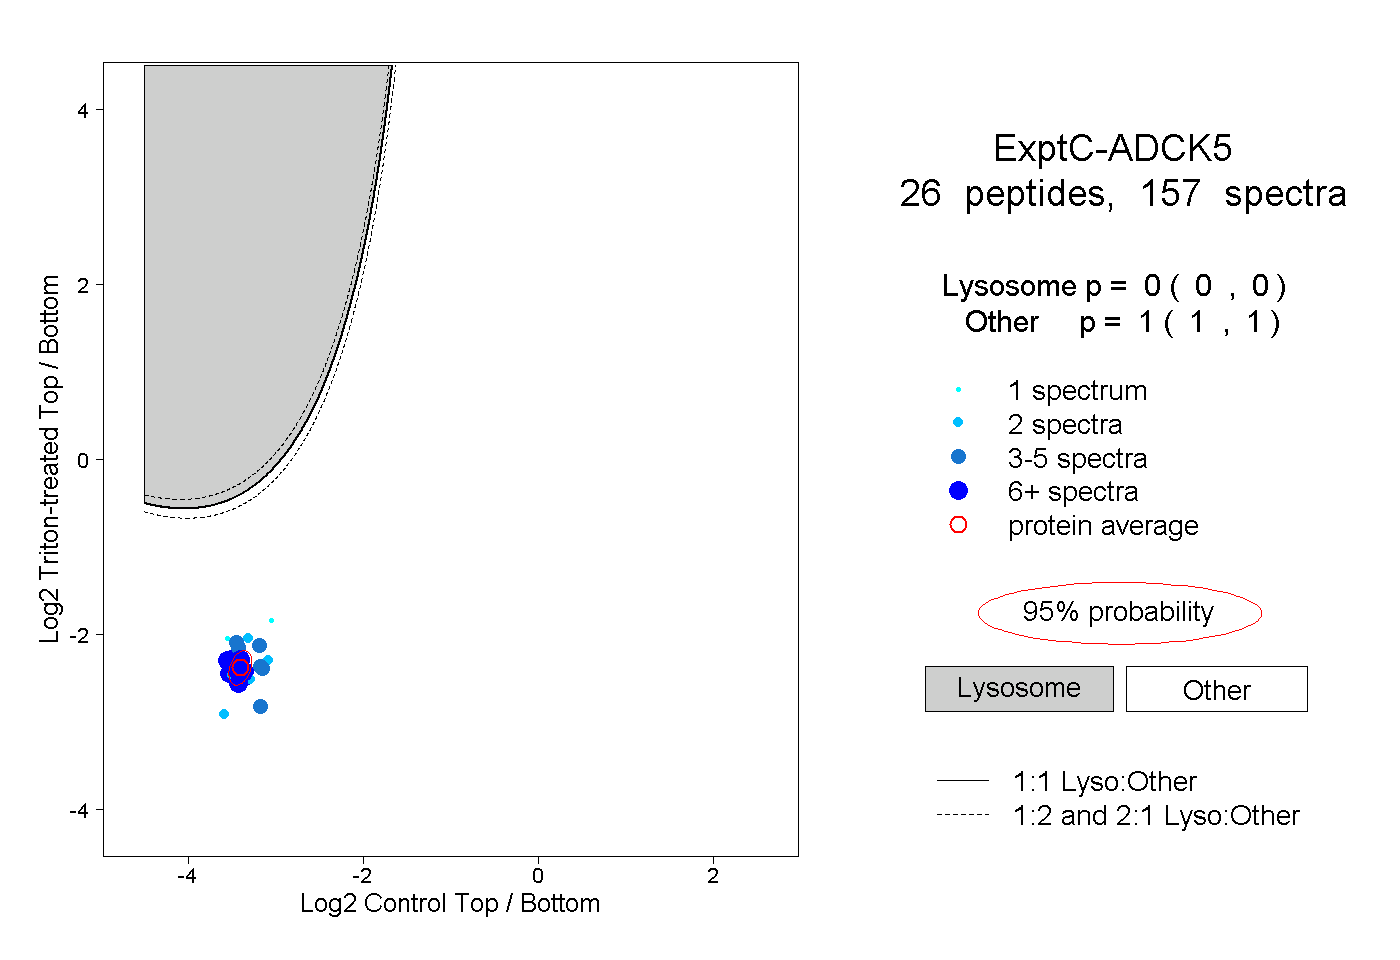 |
0.000 0.000 | 0.000 |
1.000 1.000 | 1.000 |
||||||||
| Plot | Lyso | Other | |||||||||||
| Expt D |
6 peptides |
14 spectra |
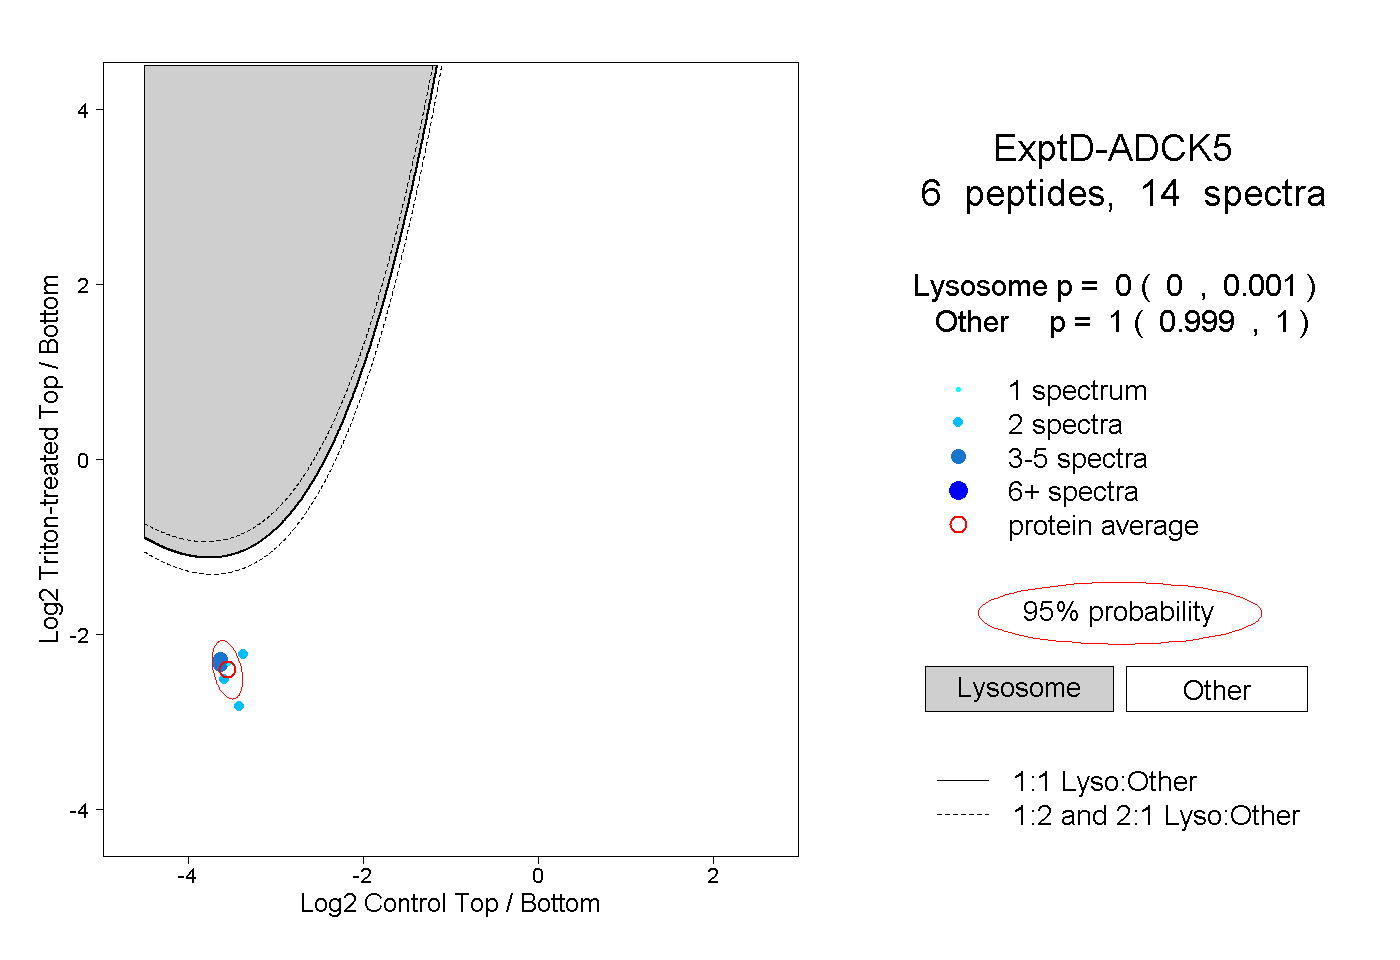 |
0.000 0.000 | 0.001 |
1.000 0.999 | 1.000 |