 19
19peptides
spectra
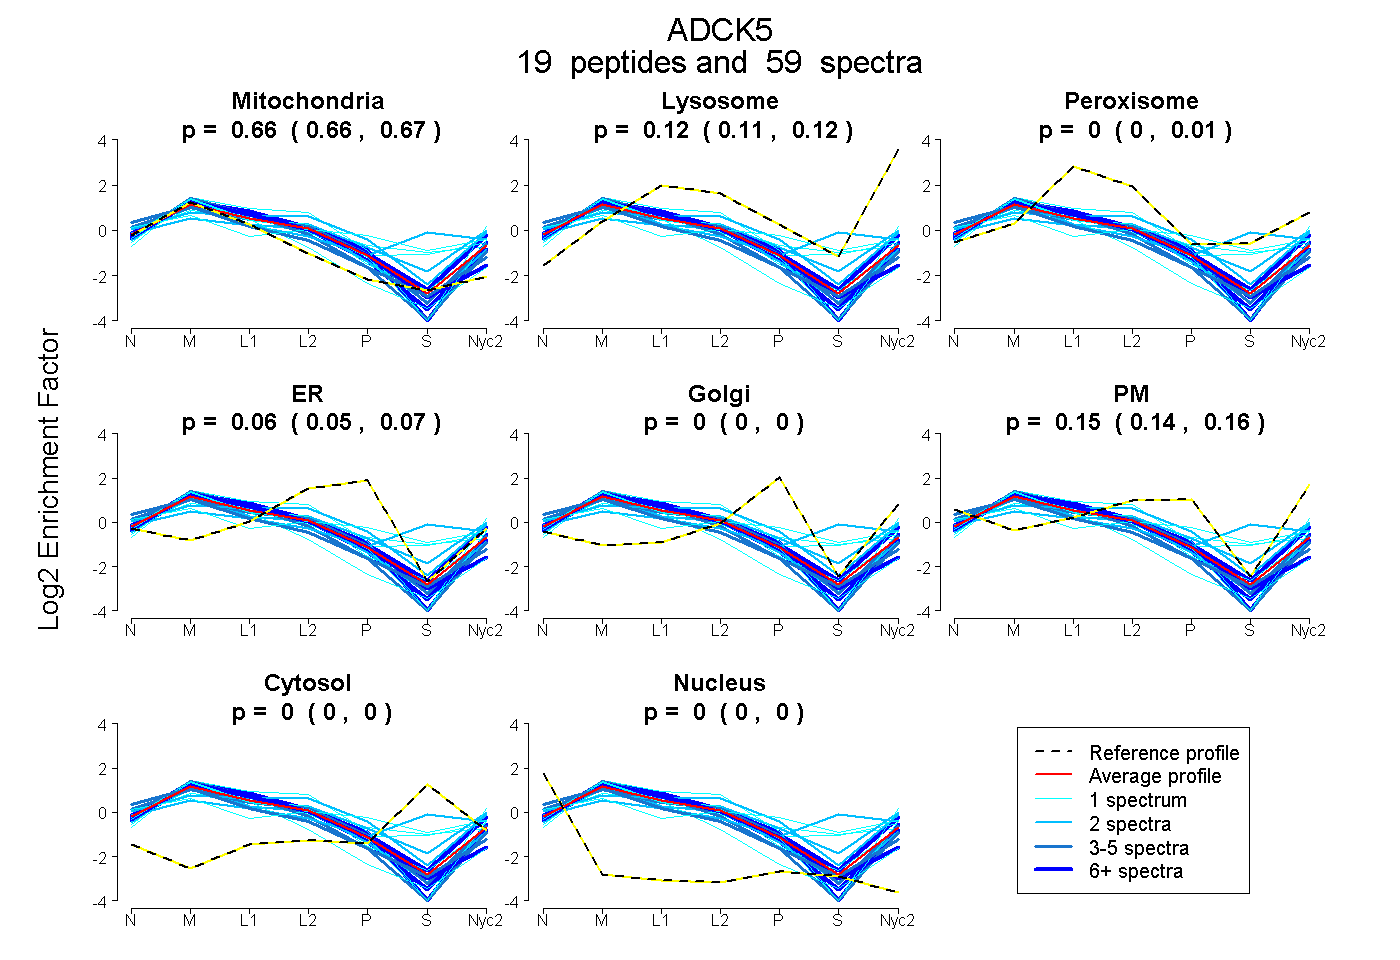
0.660 | 0.668
0.112 | 0.125
0.000 | 0.007
0.054 | 0.072
0.000 | 0.000
0.138 | 0.161
0.000 | 0.000
0.000 | 0.000
6peptides
spectra
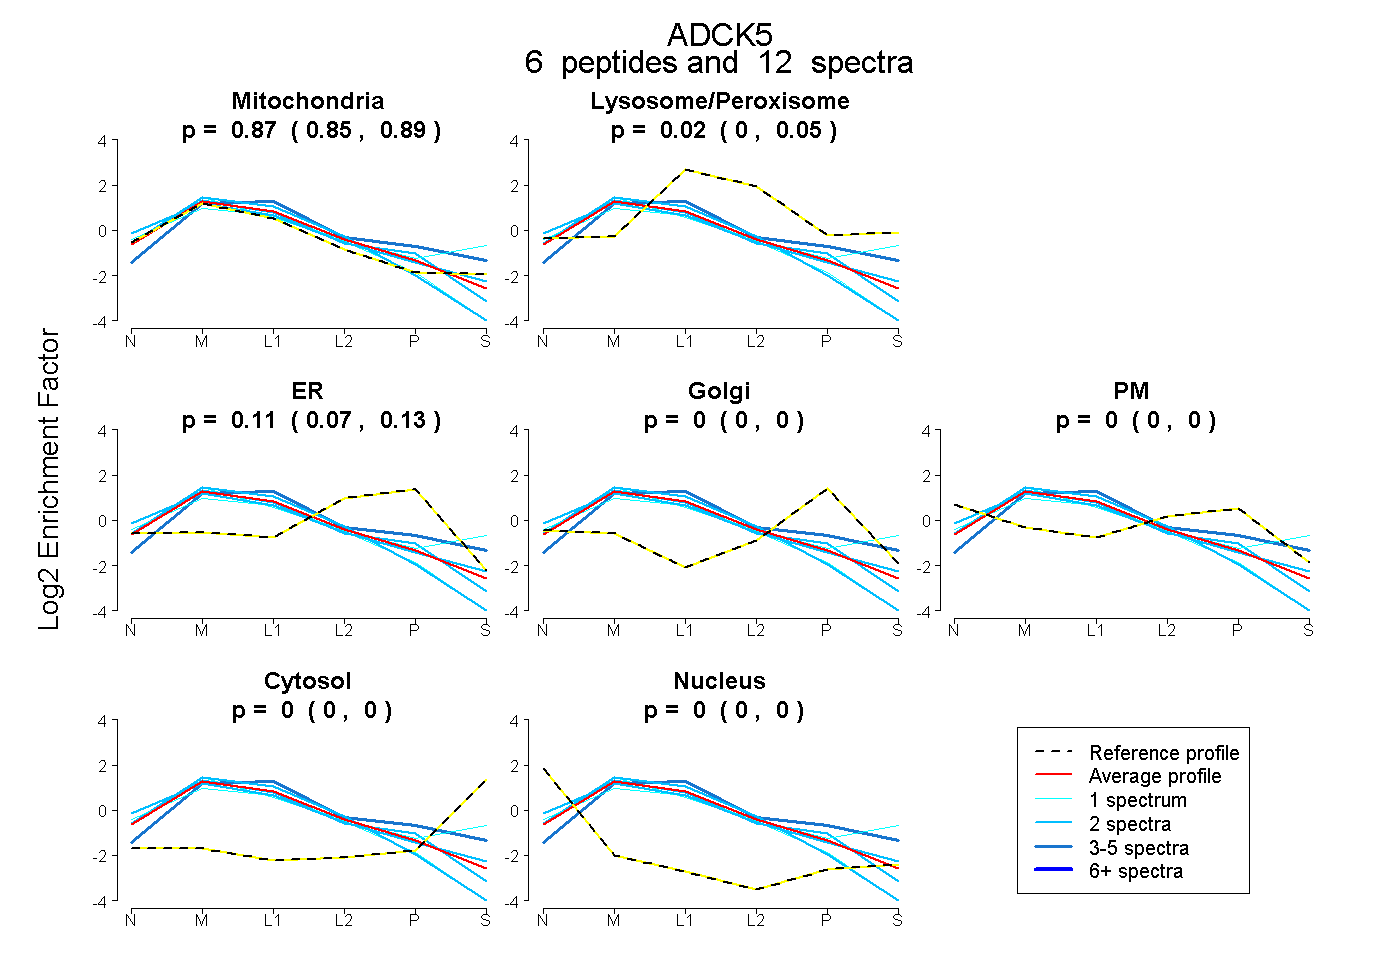
0.848 | 0.894
0.000 | 0.054
0.072 | 0.131
0.000 | 0.000
0.000 | 0.000
0.000 | 0.000
0.000 | 0.000
26peptides
spectra
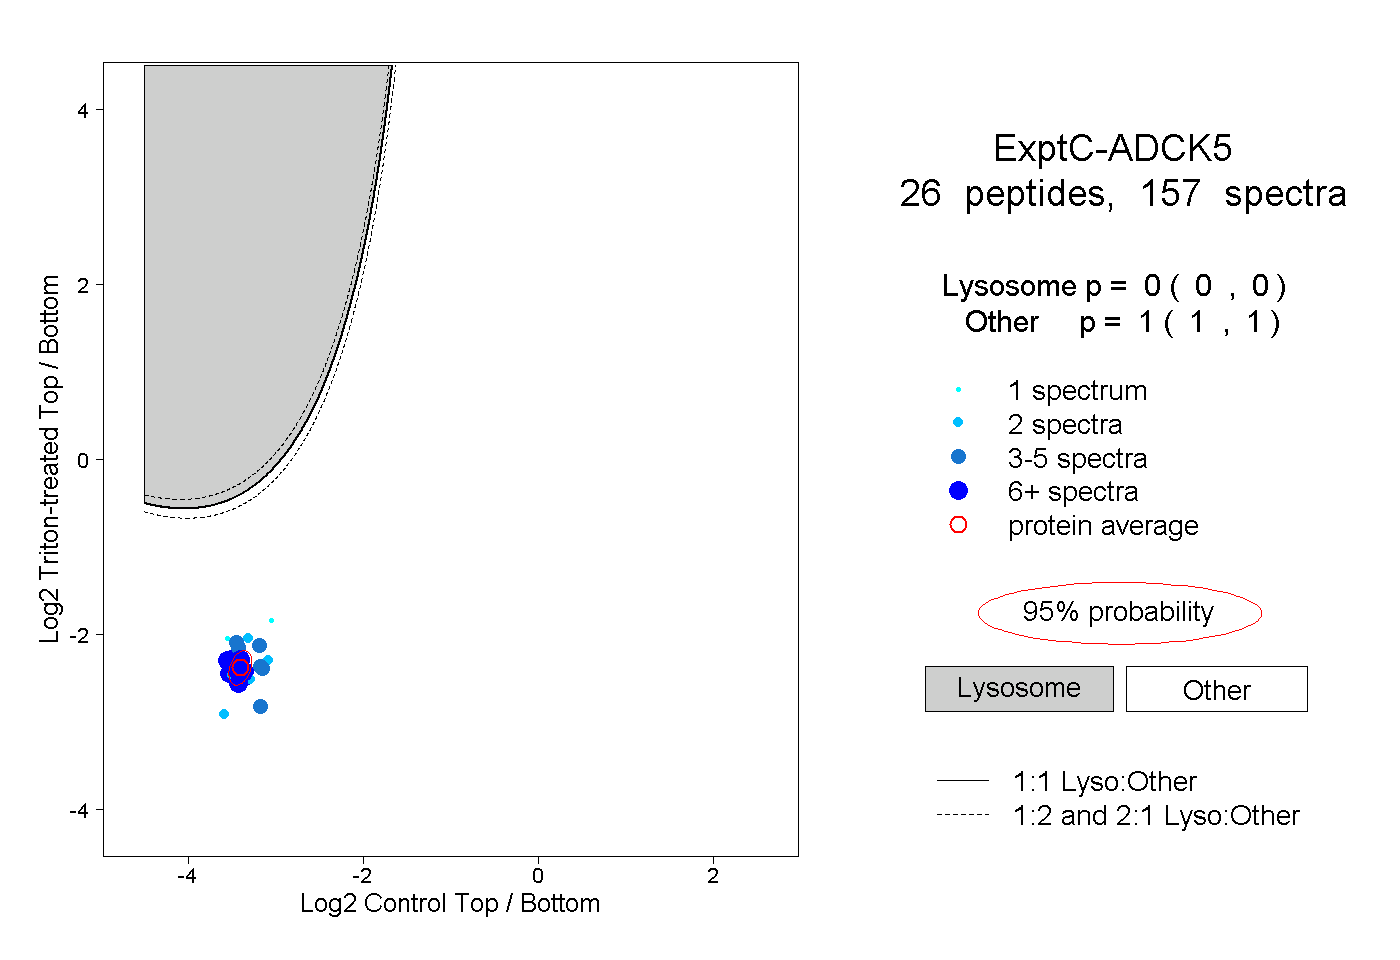
0.000 | 0.000
1.000 | 1.000
6peptides
spectra
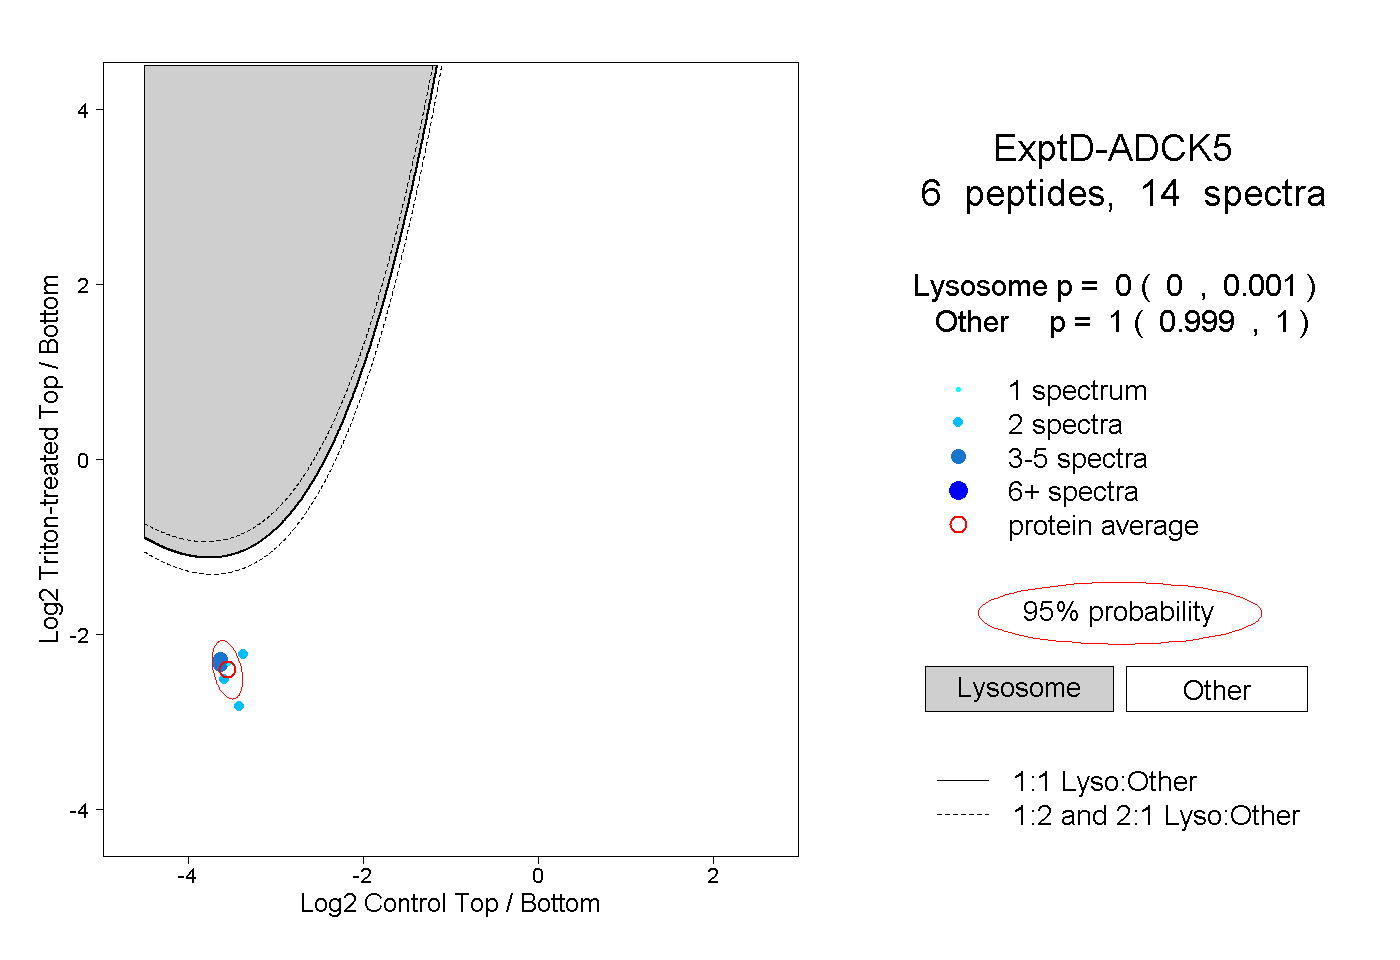
0.000 | 0.001
0.999 | 1.000