11
11peptides
spectra
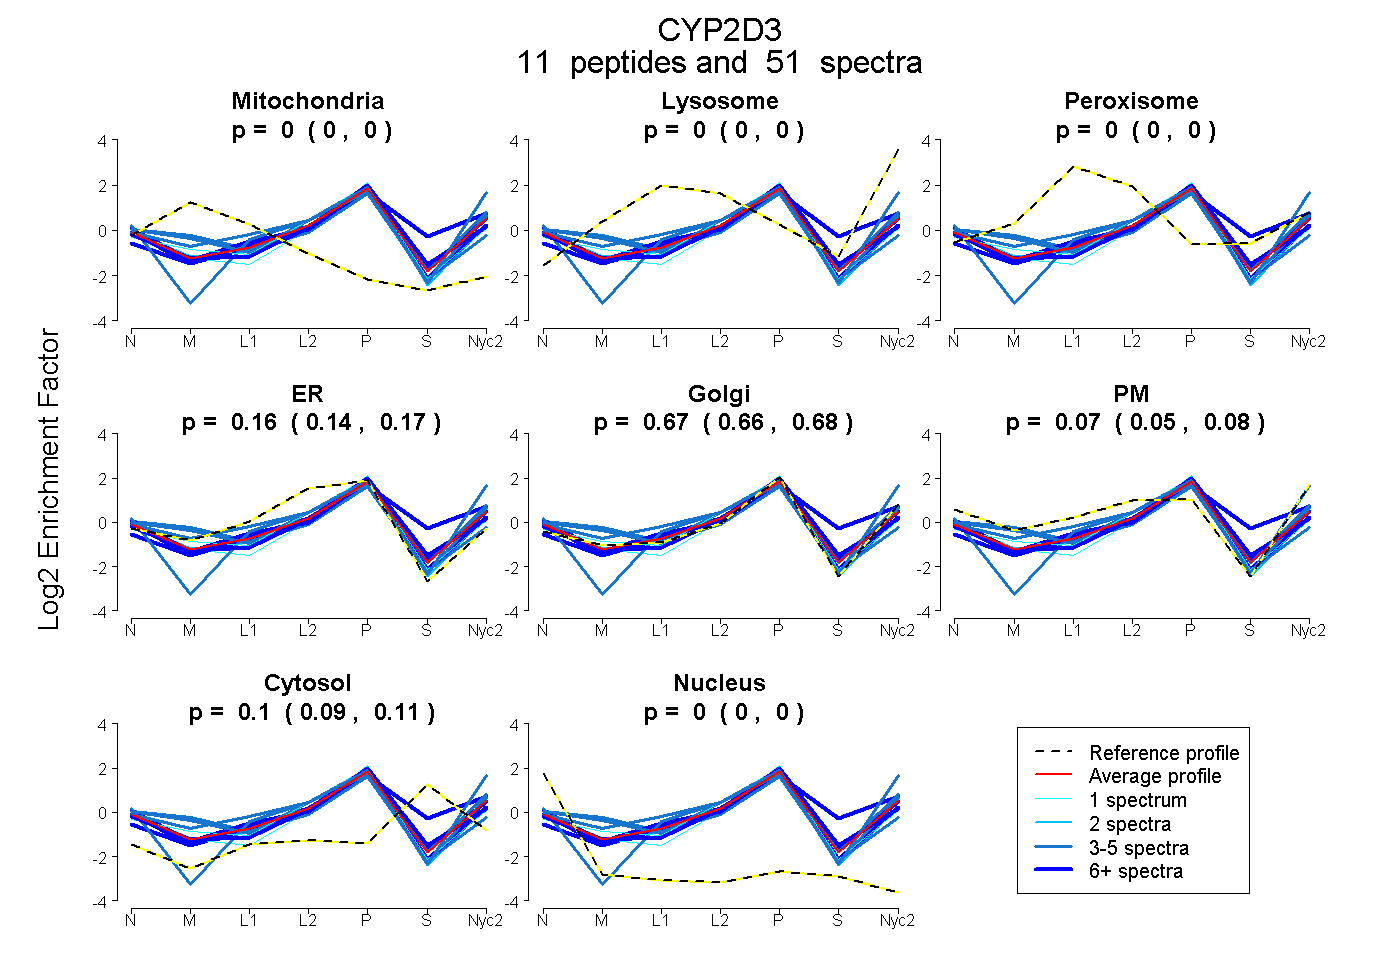
0.000 | 0.000
0.000 | 0.000
0.000 | 0.000
0.141 | 0.171
0.656 | 0.684
0.054 | 0.083
0.094 | 0.108
0.000 | 0.000
9peptides
spectra
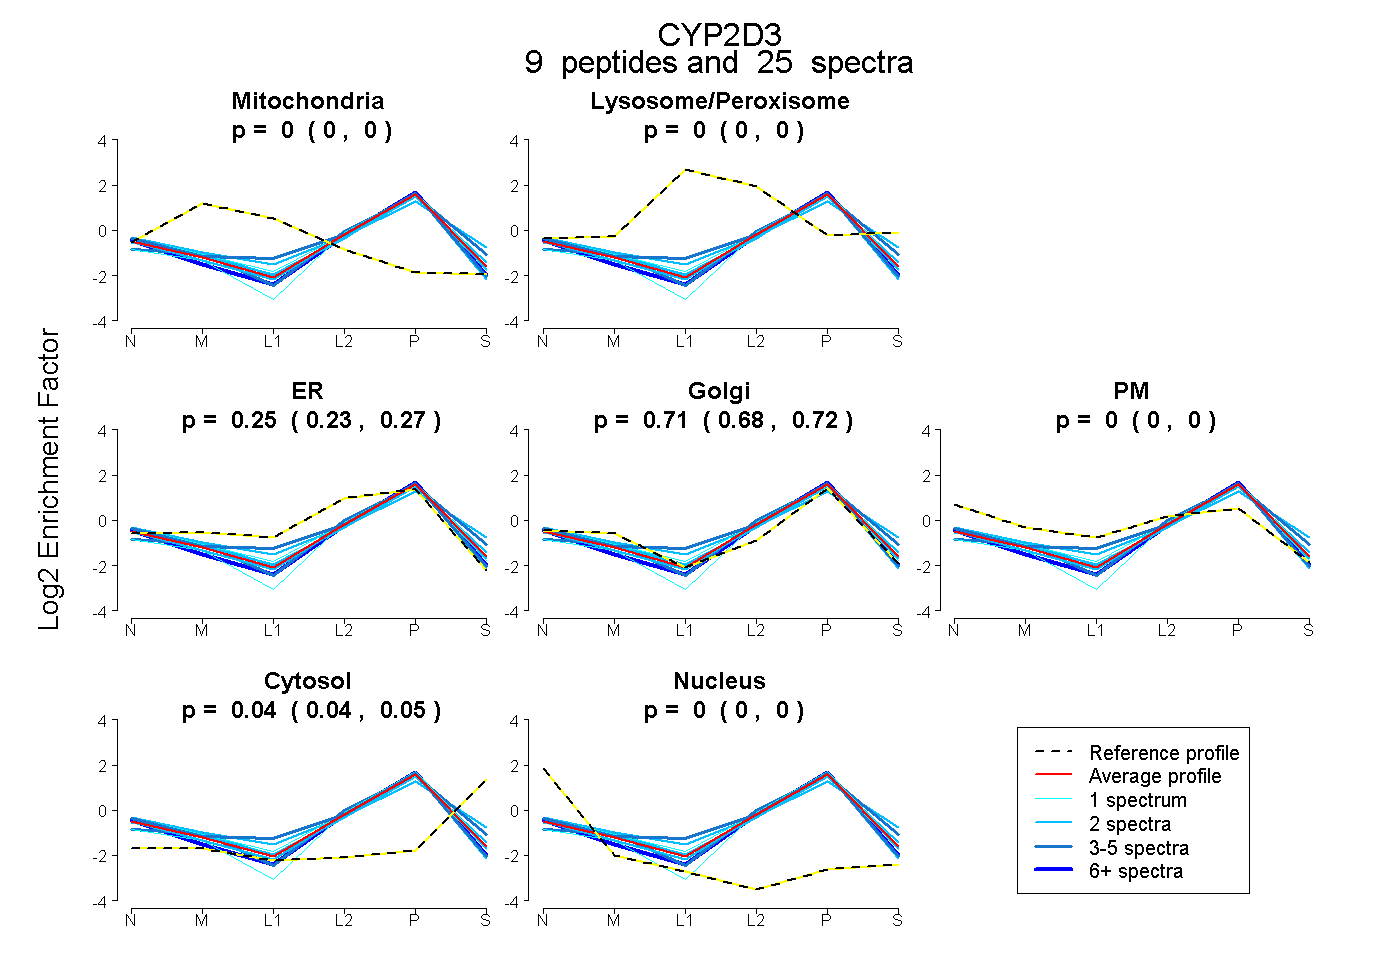
0.000 | 0.000
0.000 | 0.000
0.231 | 0.265
0.683 | 0.725
0.000 | 0.000
0.036 | 0.053
0.000 | 0.000
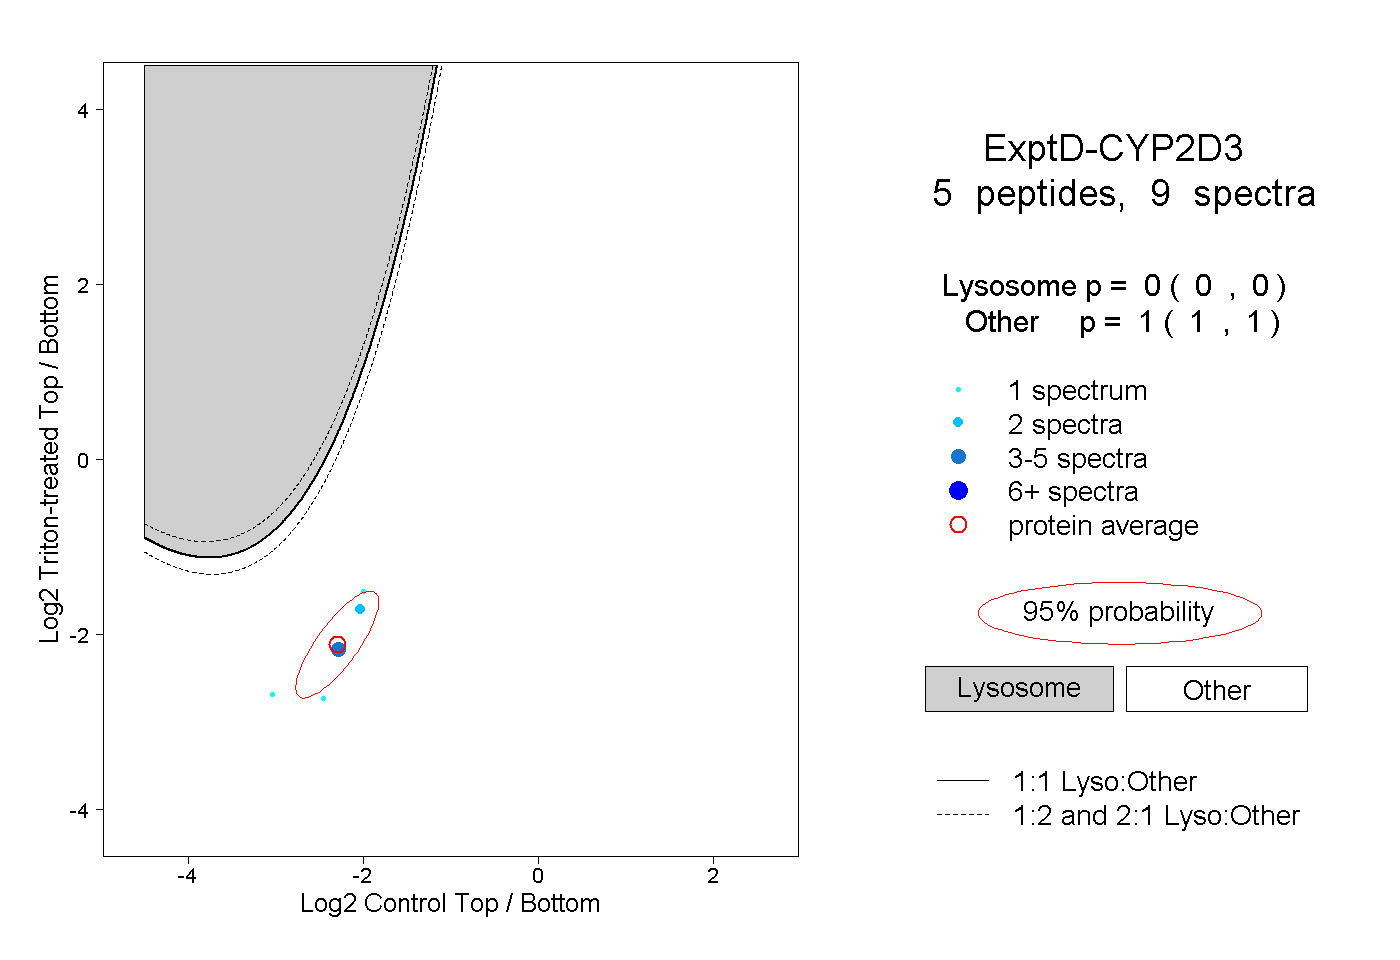
10peptides
spectra
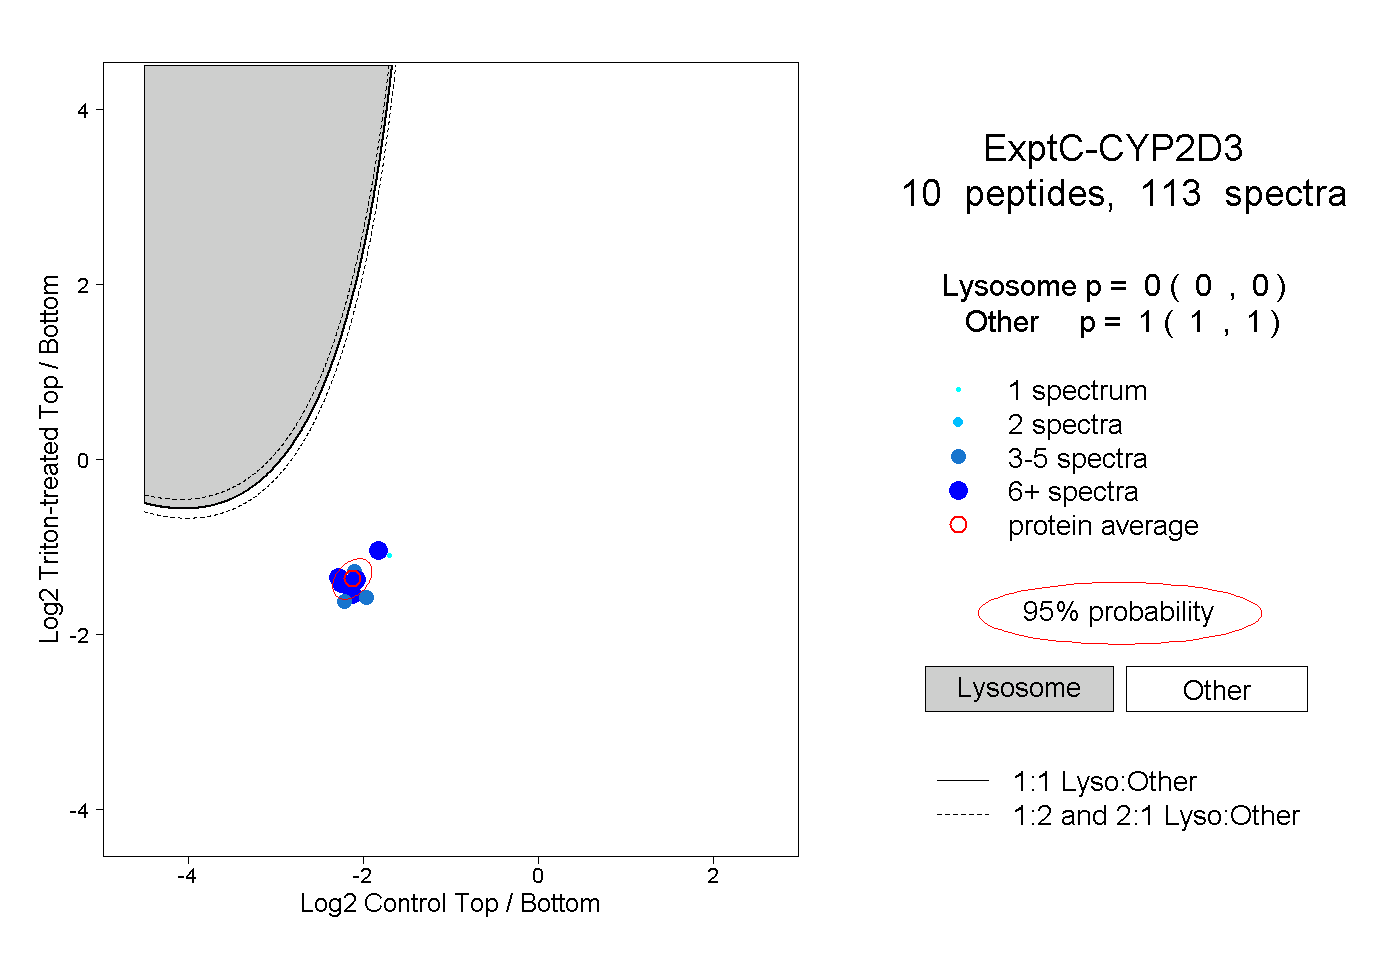
0.000 | 0.000
1.000 | 1.000