 11
11peptides
spectra
0.000 | 0.000
0.000 | 0.000
0.000 | 0.000
0.141 | 0.171
0.656 | 0.684
0.054 | 0.083
0.094 | 0.108
0.000 | 0.000
| Plot | Mito | Lyso | Perox | ER | Golgi | PM | Cytosol | Nucleus | |||||
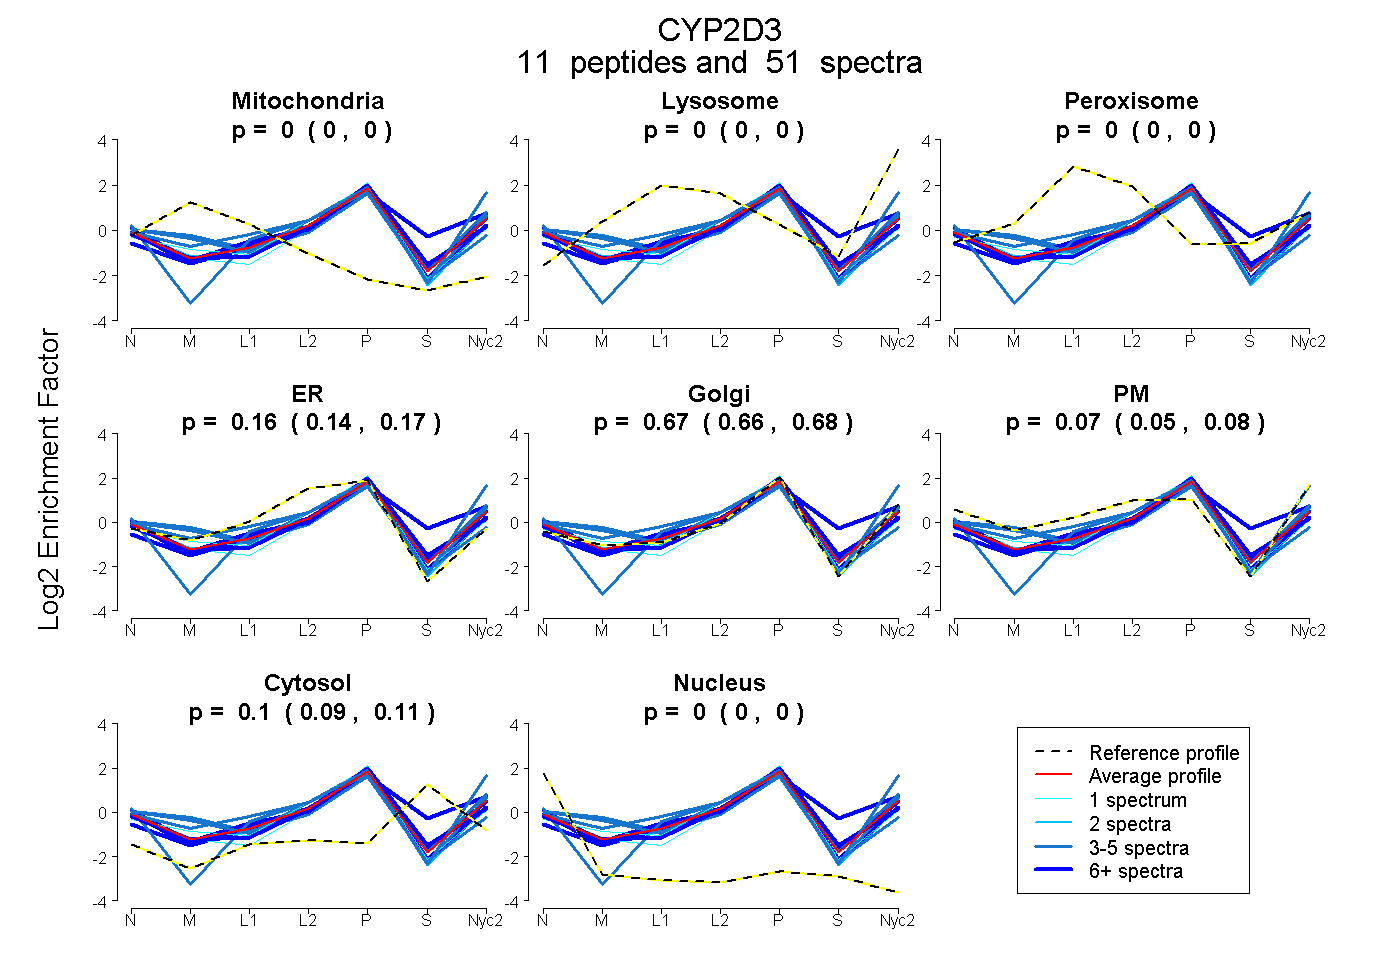
| Expt A |
11 peptides |
51 spectra |
|
0.000 0.000 | 0.000 |
0.000 0.000 | 0.000 |
0.000 0.000 | 0.000 |
0.158 0.141 | 0.171 |
0.671 0.656 | 0.684 |
0.069 0.054 | 0.083 |
0.102 0.094 | 0.108 |
0.000 0.000 | 0.000 |
| 6 spectra, TWDPDQPPR | 0.000 | 0.000 | 0.000 | 0.148 | 0.708 | 0.000 | 0.145 | 0.000 | ||
| 1 spectrum, TFLTMVDNLVTEHK | 0.000 | 0.000 | 0.000 | 0.320 | 0.619 | 0.000 | 0.042 | 0.018 | ||
| 4 spectra, HPEMADQAHMPFTNAVIHEVQR | 0.000 | 0.000 | 0.000 | 0.193 | 0.637 | 0.024 | 0.146 | 0.000 | ||
| 1 spectrum, ESMGEQTGLFPEVLNMFPVLLR | 0.000 | 0.000 | 0.000 | 0.000 | 0.955 | 0.000 | 0.000 | 0.045 | ||
| 8 spectra, DLTDAFLAEIEK | 0.000 | 0.109 | 0.000 | 0.010 | 0.584 | 0.000 | 0.297 | 0.000 | ||
| 4 spectra, NFGVGK | 0.048 | 0.000 | 0.000 | 0.099 | 0.651 | 0.202 | 0.000 | 0.000 | ||
| 10 spectra, FADIVPMNLPHK | 0.000 | 0.000 | 0.000 | 0.164 | 0.628 | 0.075 | 0.134 | 0.000 | ||
| 8 spectra, GNPESSFNDANLR | 0.000 | 0.000 | 0.007 | 0.232 | 0.665 | 0.012 | 0.037 | 0.047 | ||
| 2 spectra, DIEVQGFLIPK | 0.000 | 0.000 | 0.000 | 0.176 | 0.772 | 0.000 | 0.000 | 0.051 | ||
| 4 spectra, VFPGQK | 0.000 | 0.097 | 0.000 | 0.000 | 0.558 | 0.344 | 0.000 | 0.000 | ||
| 3 spectra, FDYGDPDFIK | 0.159 | 0.000 | 0.000 | 0.170 | 0.645 | 0.000 | 0.000 | 0.026 |
| Plot | Mito | Lyso or Perox | ER | Golgi | PM | Cytosol | Nucleus | ||||||
| Expt B |
9 peptides |
25 spectra |
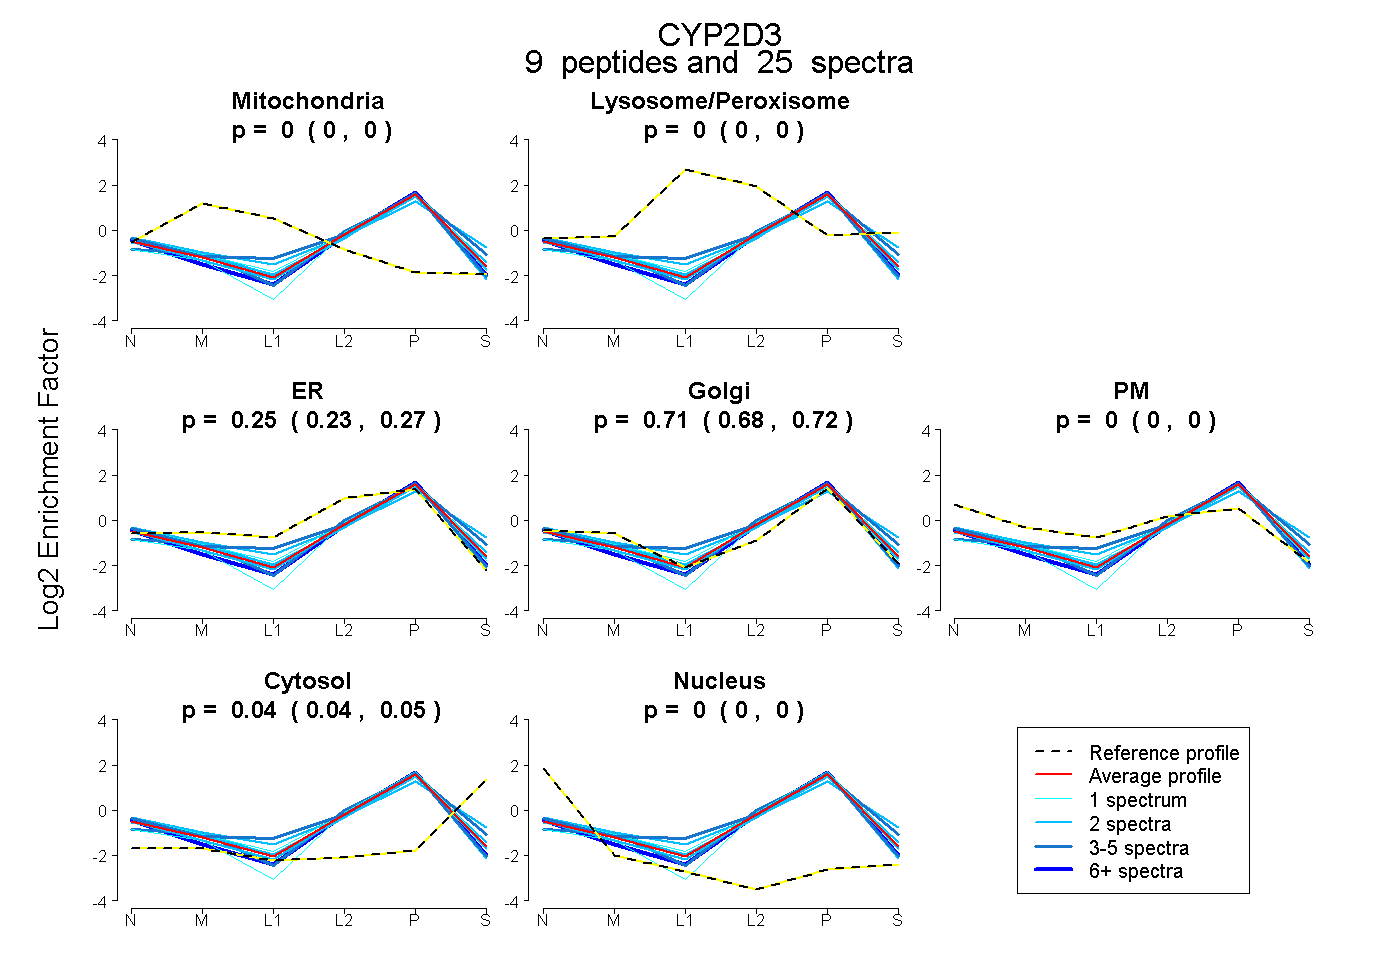 |
0.000 0.000 | 0.000 |
0.000 0.000 | 0.000 |
0.249 0.231 | 0.265 |
0.706 0.683 | 0.725 |
0.000 0.000 | 0.000 |
0.045 0.036 | 0.053 |
0.000 0.000 | 0.000 |
|||
| Plot | Lyso | Other | |||||||||||
| Expt C |
10 peptides |
113 spectra |
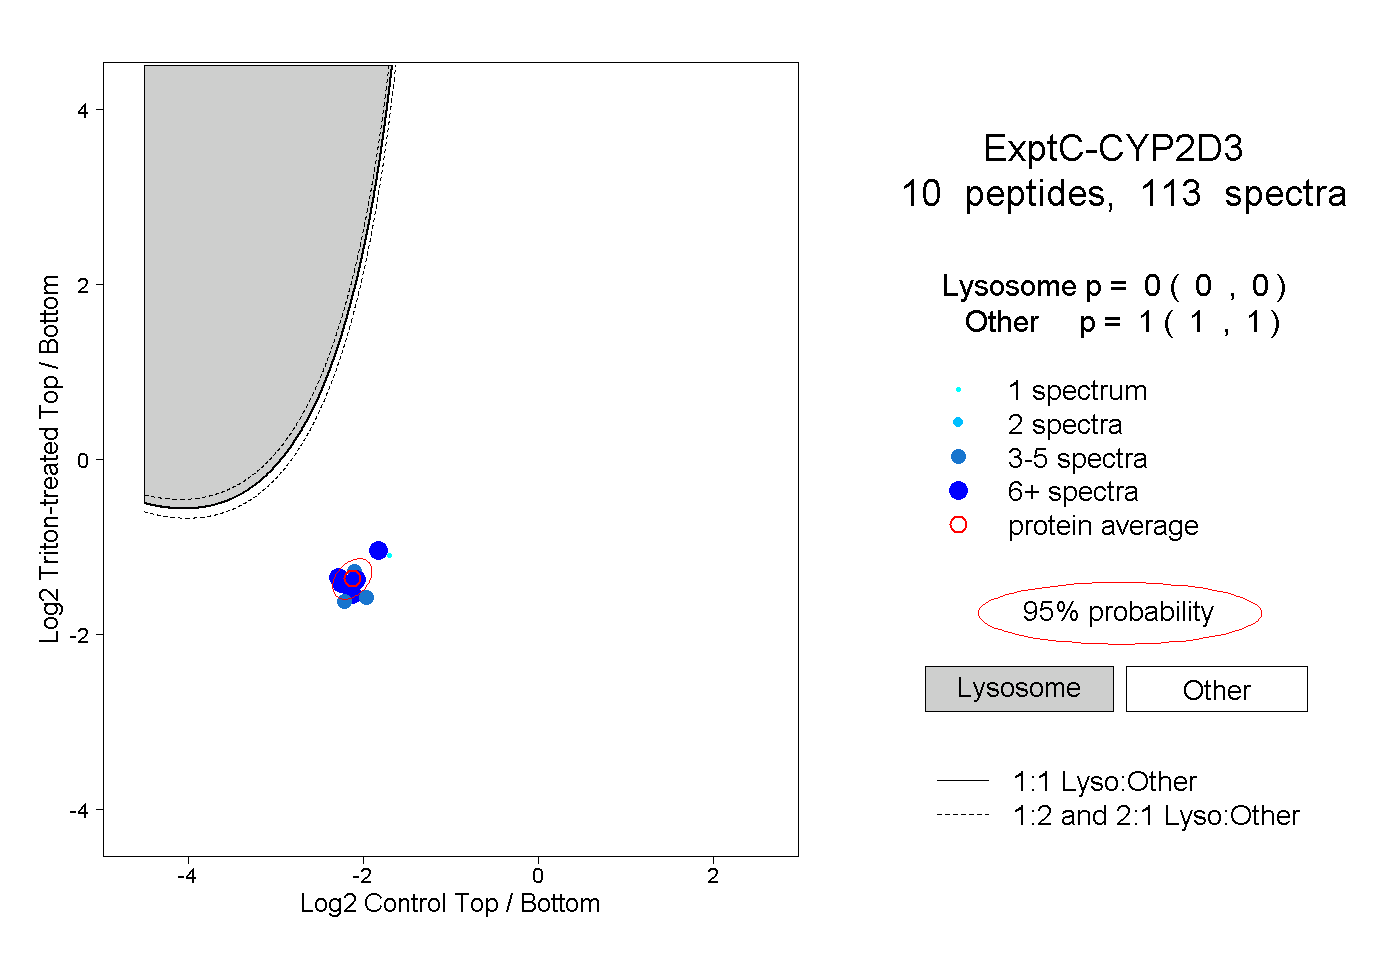 |
0.000 0.000 | 0.000 |
1.000 1.000 | 1.000 |
||||||||
| Plot | Lyso | Other | |||||||||||
| Expt D |
5 peptides |
9 spectra |
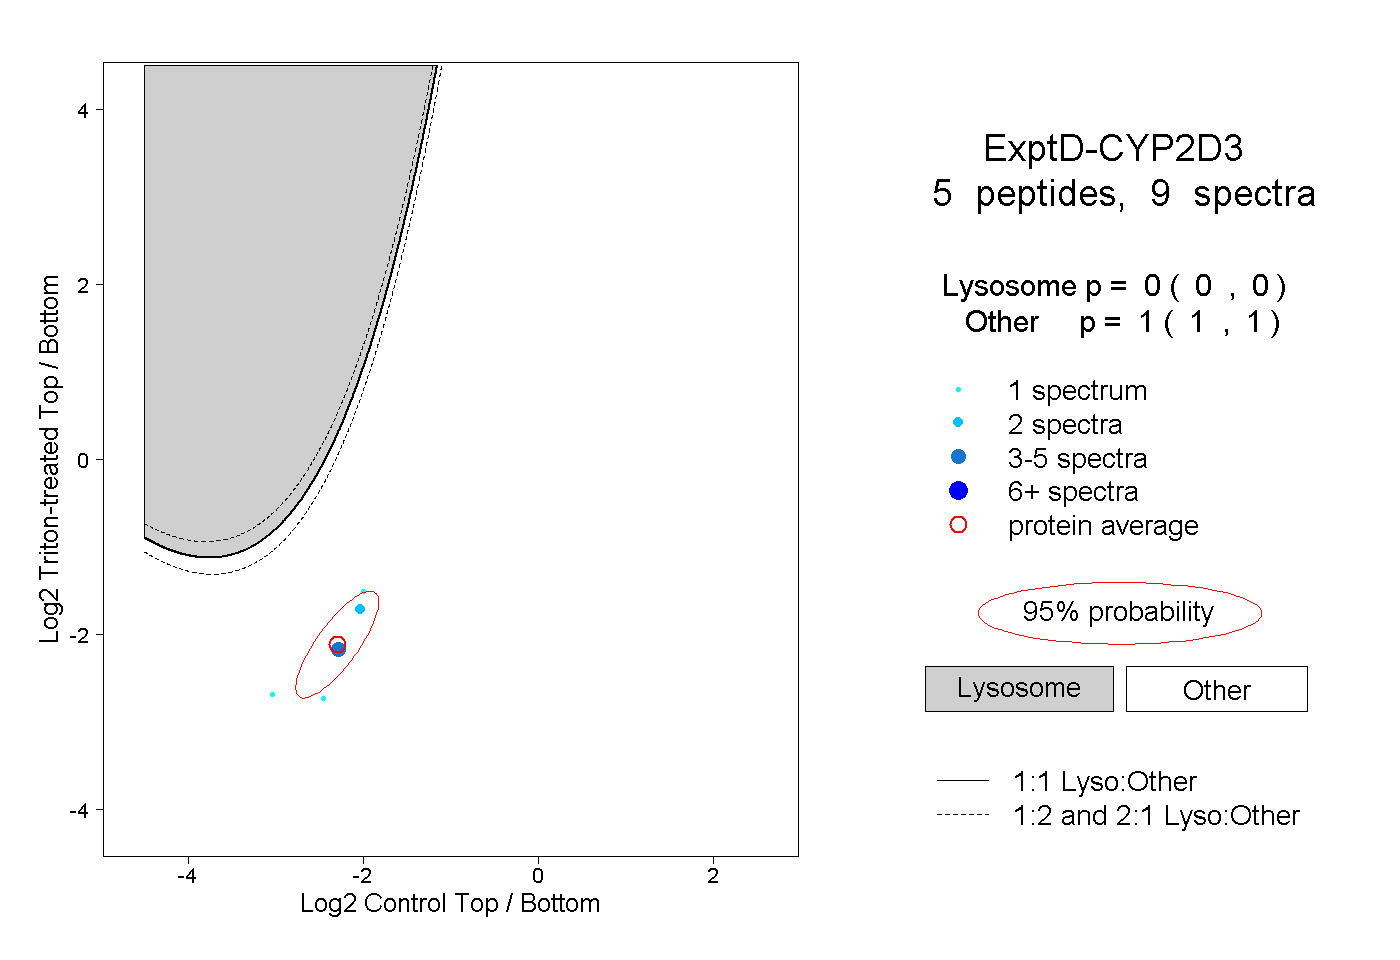 |
0.000 0.000 | 0.000 |
1.000 1.000 | 1.000 |