 3
3peptides
spectra
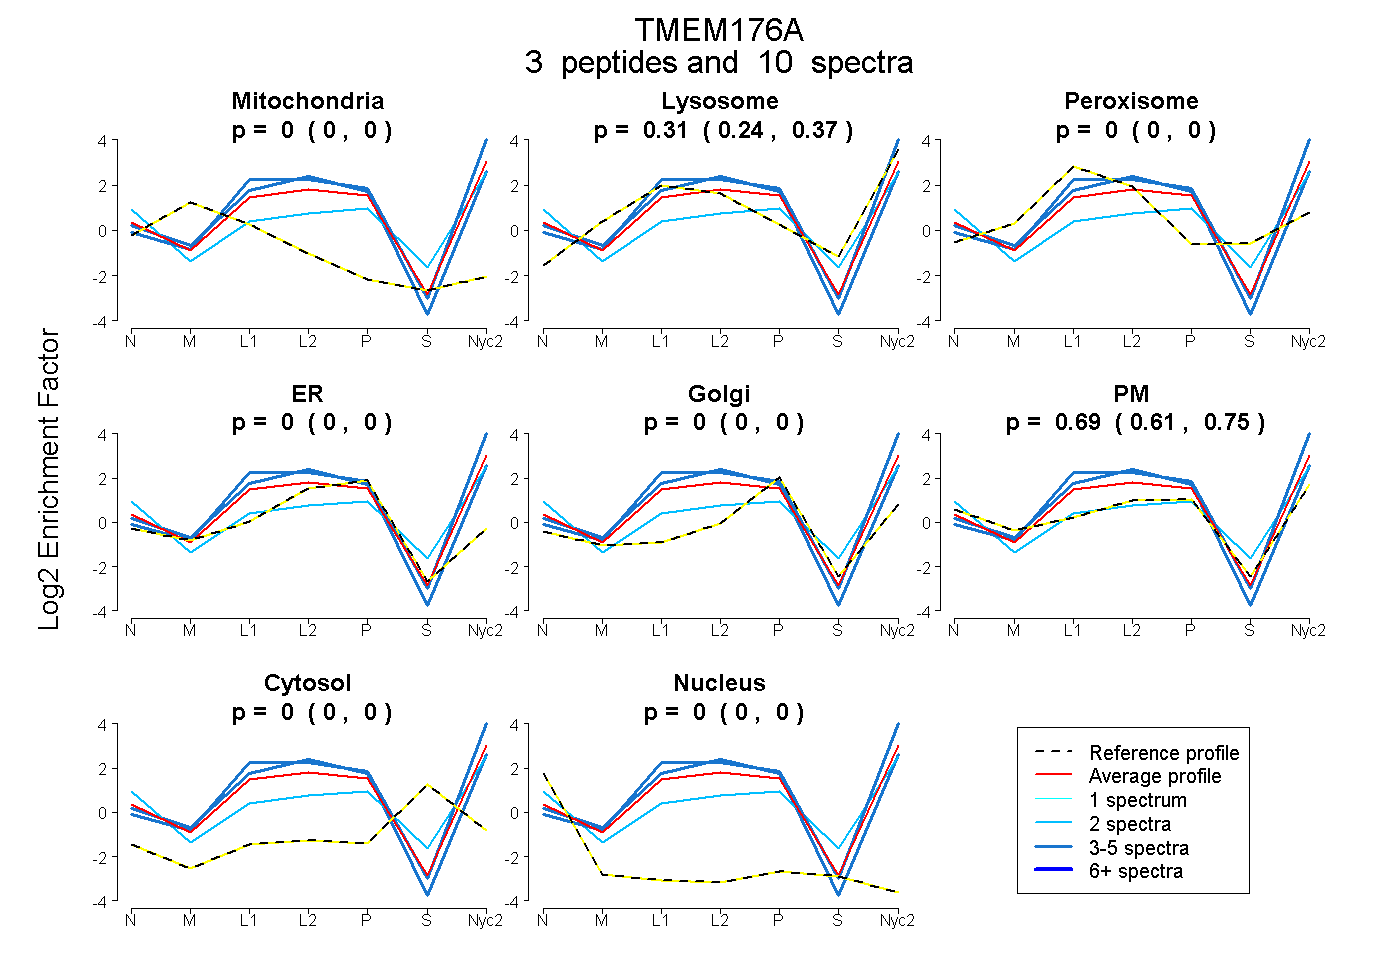
0.000 | 0.000
0.237 | 0.375
0.000 | 0.000
0.000 | 0.000
0.000 | 0.000
0.611 | 0.749
0.000 | 0.000
0.000 | 0.000
2peptides
spectra
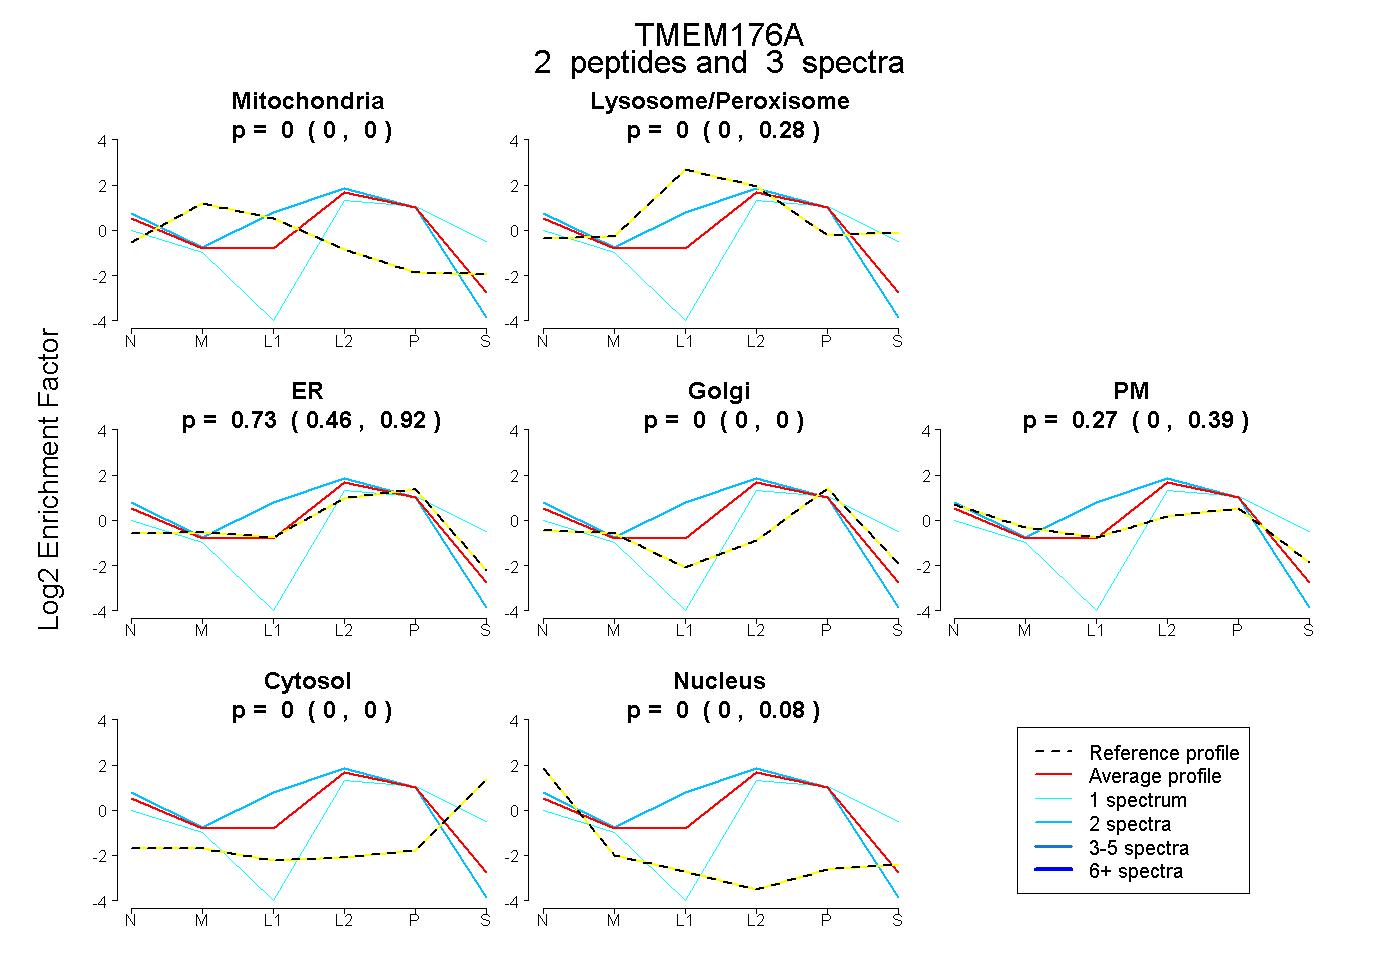
0.000 | 0.000
0.000 | 0.278
0.461 | 0.922
0.000 | 0.000
0.000 | 0.391
0.000 | 0.000
0.000 | 0.077
5peptides
spectra
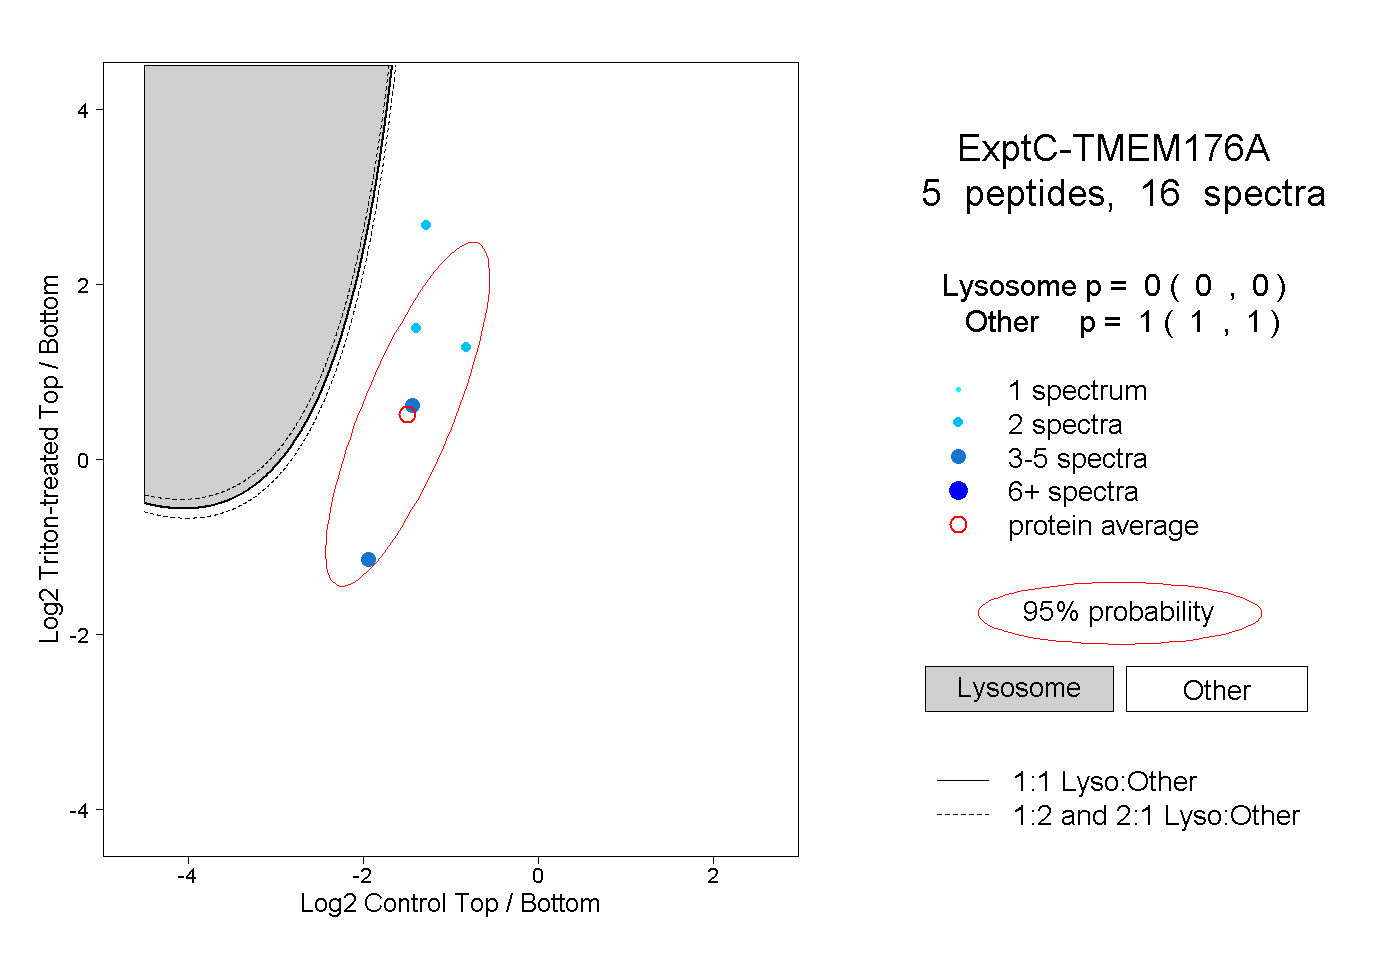
0.000 | 0.000
1.000 | 1.000