 4
4peptides
spectra
0.000 | 0.000
0.000 | 0.000
0.000 | 0.000
0.546 | 0.555
0.000 | 0.000
0.000 | 0.000
0.156 | 0.174
0.278 | 0.288
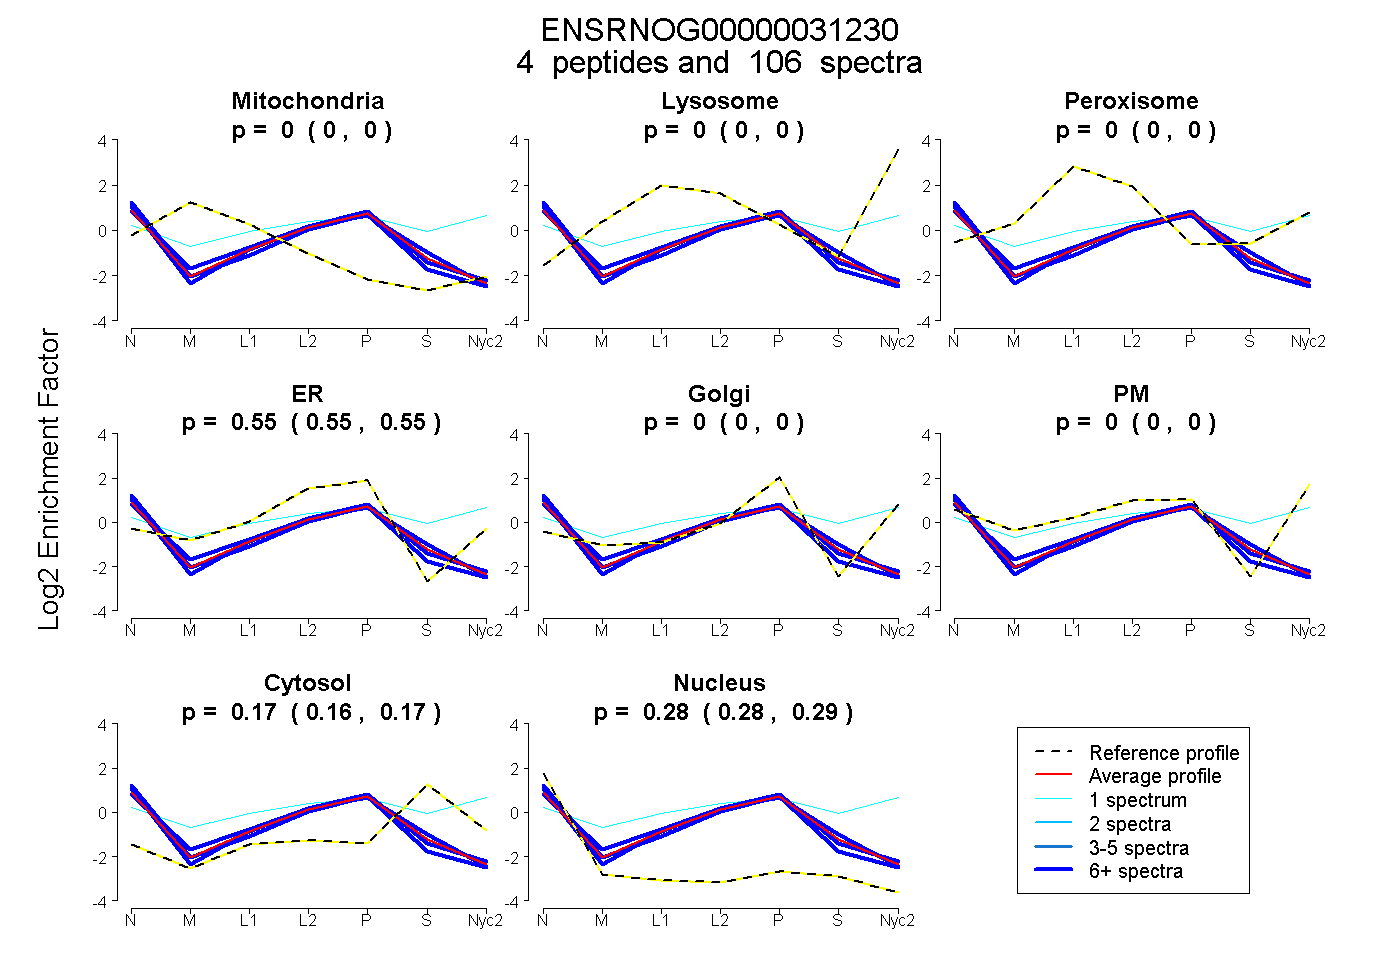
| Plot | Mito | Lyso | Perox | ER | Golgi | PM | Cytosol | Nucleus | |||||
| Expt A |
4 peptides |
106 spectra |
|
0.000 0.000 | 0.000 |
0.000 0.000 | 0.000 |
0.000 0.000 | 0.000 |
0.551 0.546 | 0.555 |
0.000 0.000 | 0.000 |
0.000 0.000 | 0.000 |
0.166 0.156 | 0.174 |
0.283 0.278 | 0.288 |
| 46 spectra, VNADNVGAEALGR | 0.000 | 0.000 | 0.000 | 0.576 | 0.000 | 0.000 | 0.045 | 0.379 | ||
| 42 spectra, ATVSGLWGK | 0.000 | 0.000 | 0.000 | 0.569 | 0.000 | 0.000 | 0.130 | 0.301 | ||
| 17 spectra, FGDLSSVSAIMGNPQVK | 0.000 | 0.000 | 0.000 | 0.542 | 0.000 | 0.000 | 0.199 | 0.259 | ||
| 1 spectrum, ATVNGLWGK | 0.000 | 0.000 | 0.154 | 0.000 | 0.011 | 0.498 | 0.338 | 0.000 |
| Plot | Mito | Lyso or Perox | ER | Golgi | PM | Cytosol | Nucleus | ||||||
| Expt B |
2 peptides |
32 spectra |
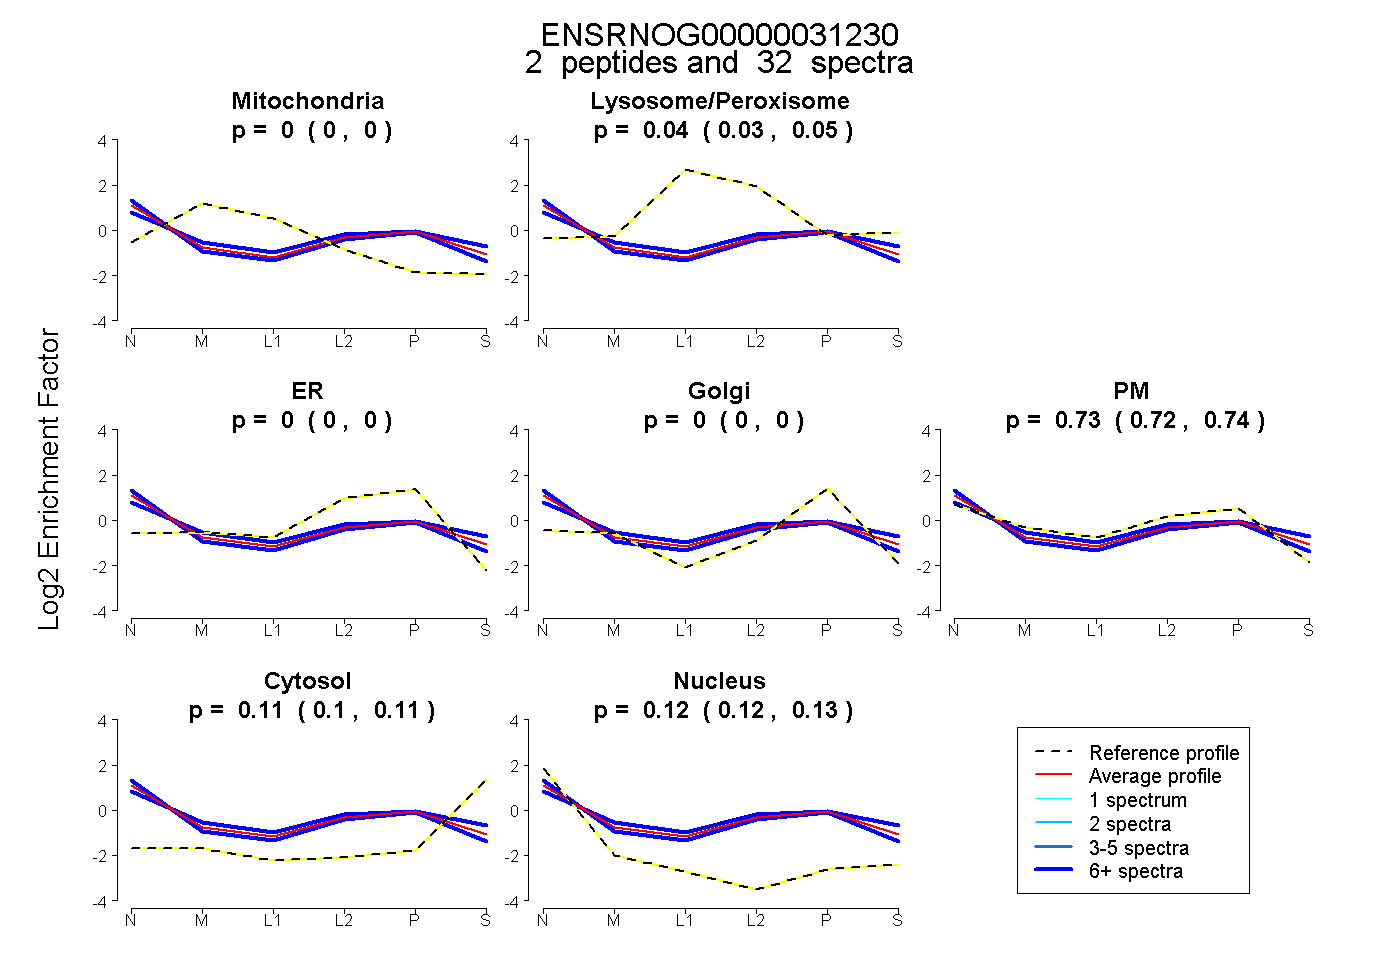 |
0.000 0.000 | 0.000 |
0.038 0.029 | 0.045 |
0.000 0.000 | 0.000 |
0.000 0.000 | 0.000 |
0.733 0.722 | 0.742 |
0.105 0.098 | 0.112 |
0.124 0.118 | 0.130 |
|||
| Plot | Lyso | Other | |||||||||||
| Expt C |
3 peptides |
94 spectra |
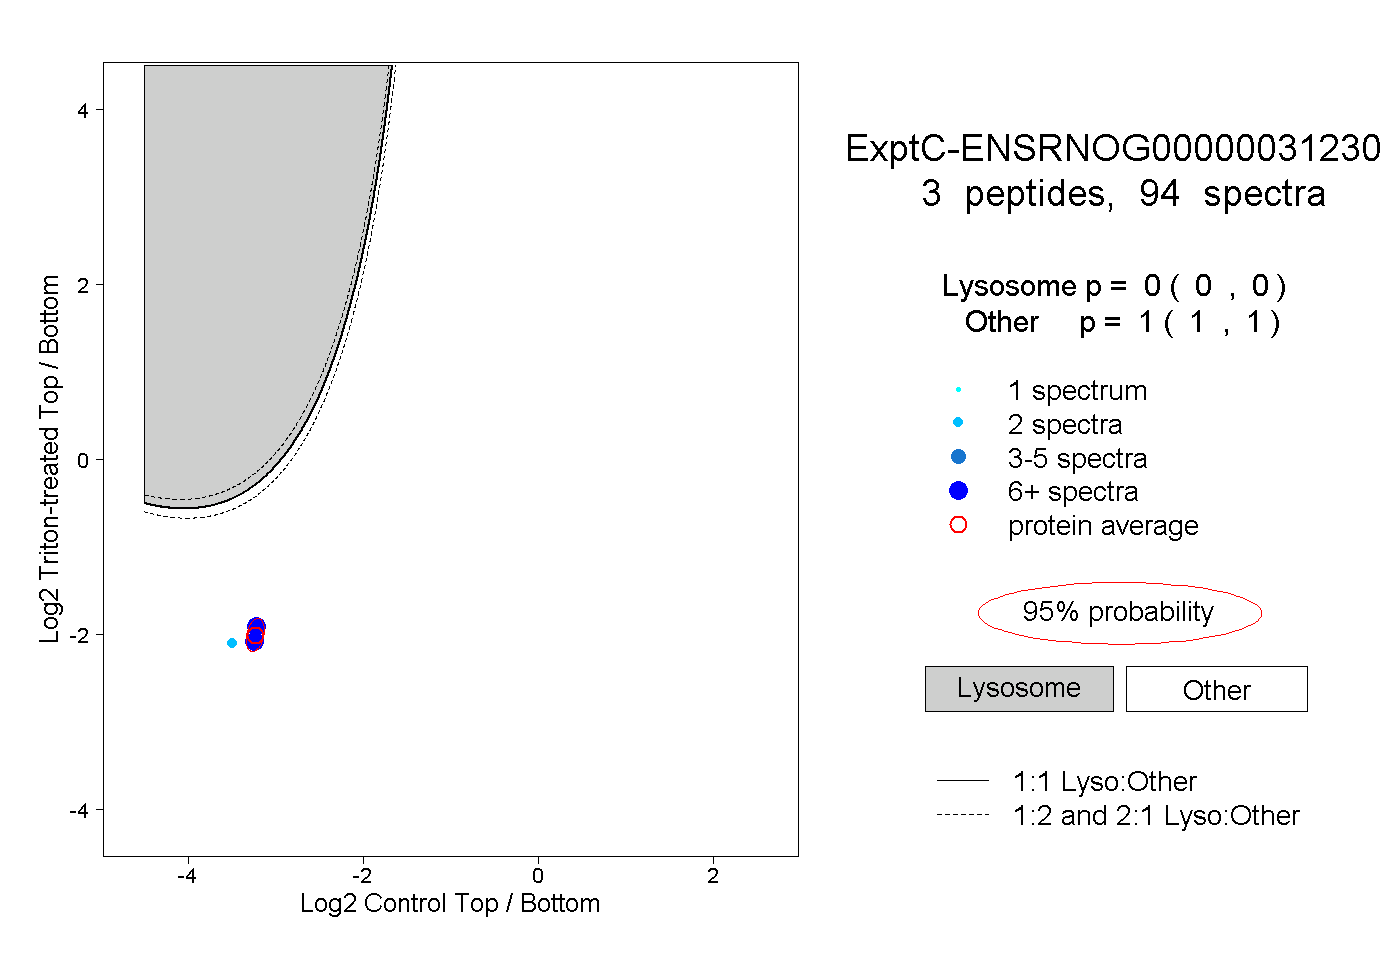 |
0.000 0.000 | 0.000 |
1.000 1.000 | 1.000 |
||||||||
| Plot | Lyso | Other | |||||||||||
| Expt D |
3 peptides |
29 spectra |
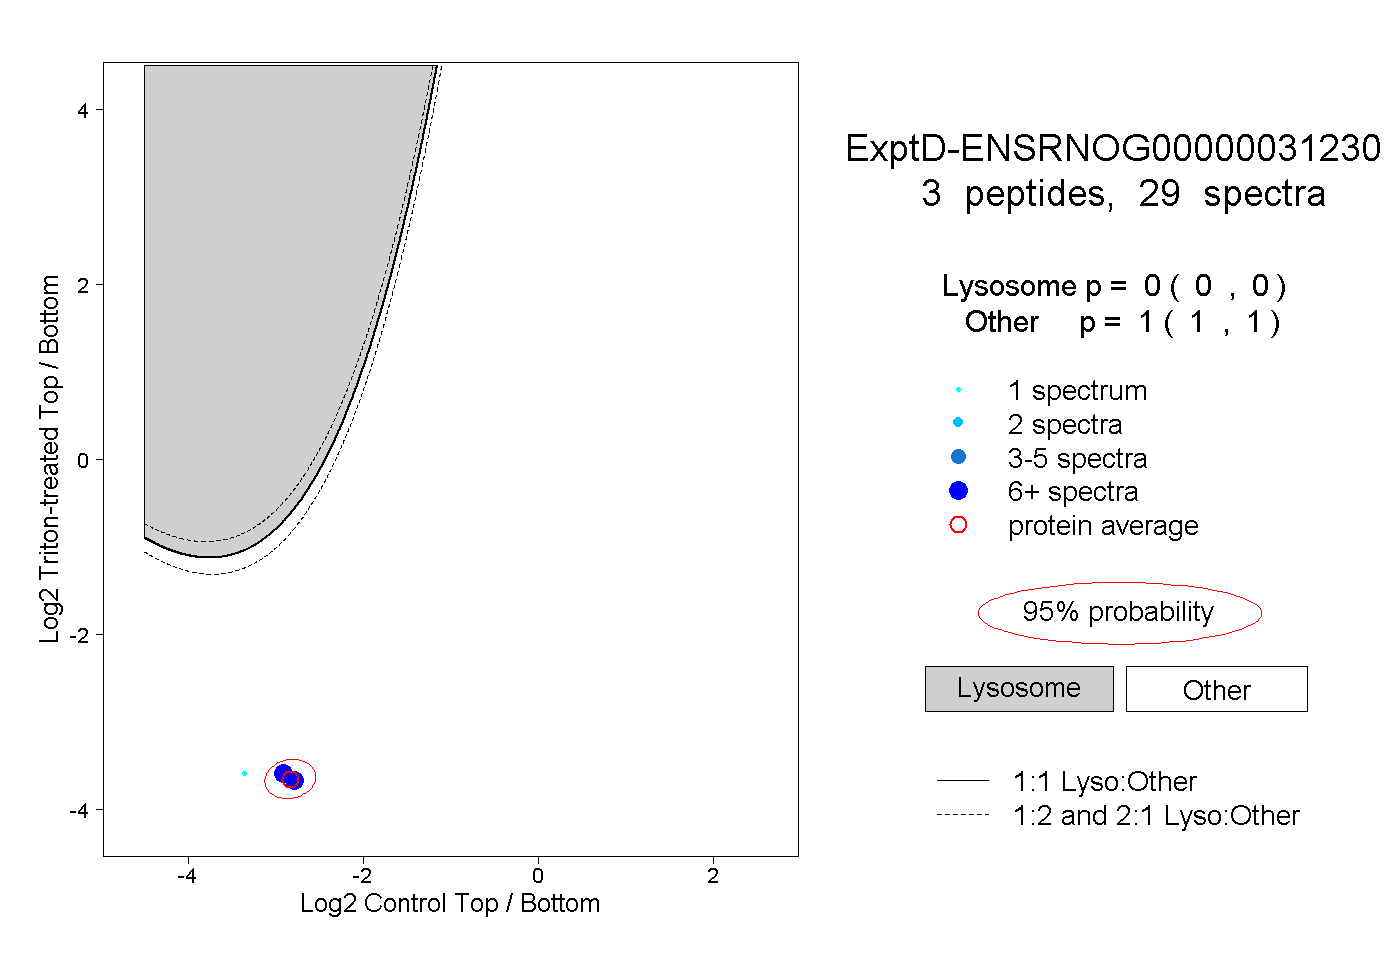 |
0.000 0.000 | 0.000 |
1.000 1.000 | 1.000 |