 1
1peptide
spectra
0.000 | 0.012
0.000 | 0.000
0.197 | 0.271
0.000 | 0.000
0.000 | 0.000
0.000 | 0.000
0.000 | 0.000
0.719 | 0.792
1peptide
spectrum
NA | NA
NA | NA
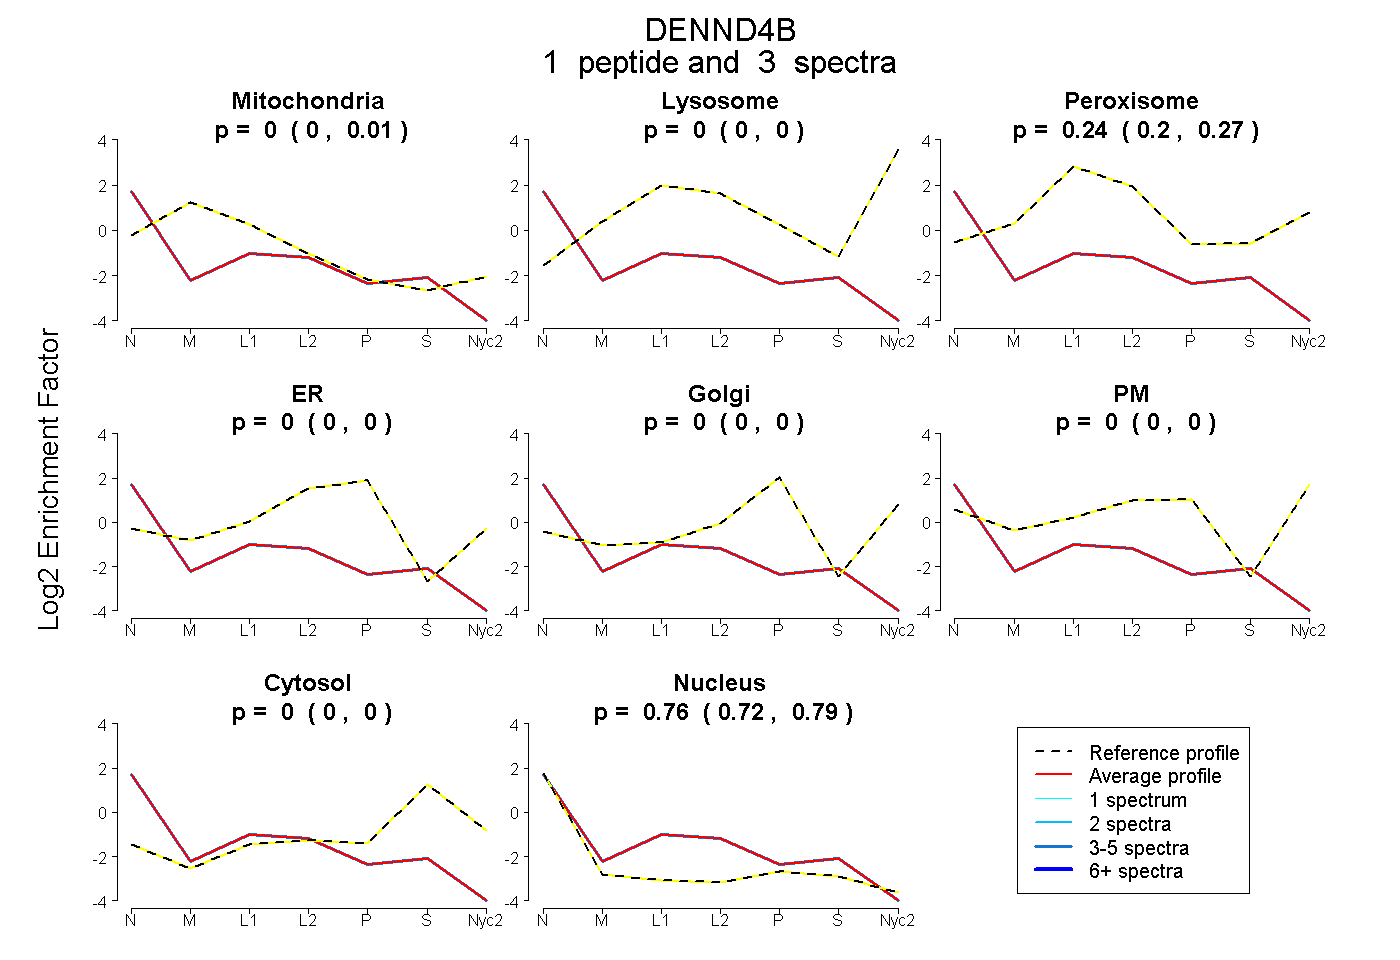
| Plot | Mito | Lyso | Perox | ER | Golgi | PM | Cytosol | Nucleus | |||||
| Expt A |
1 peptide |
3 spectra |
|
0.000 0.000 | 0.012 |
0.000 0.000 | 0.000 |
0.239 0.197 | 0.271 |
0.000 0.000 | 0.000 |
0.000 0.000 | 0.000 |
0.000 0.000 | 0.000 |
0.000 0.000 | 0.000 |
0.761 0.719 | 0.792 |
||
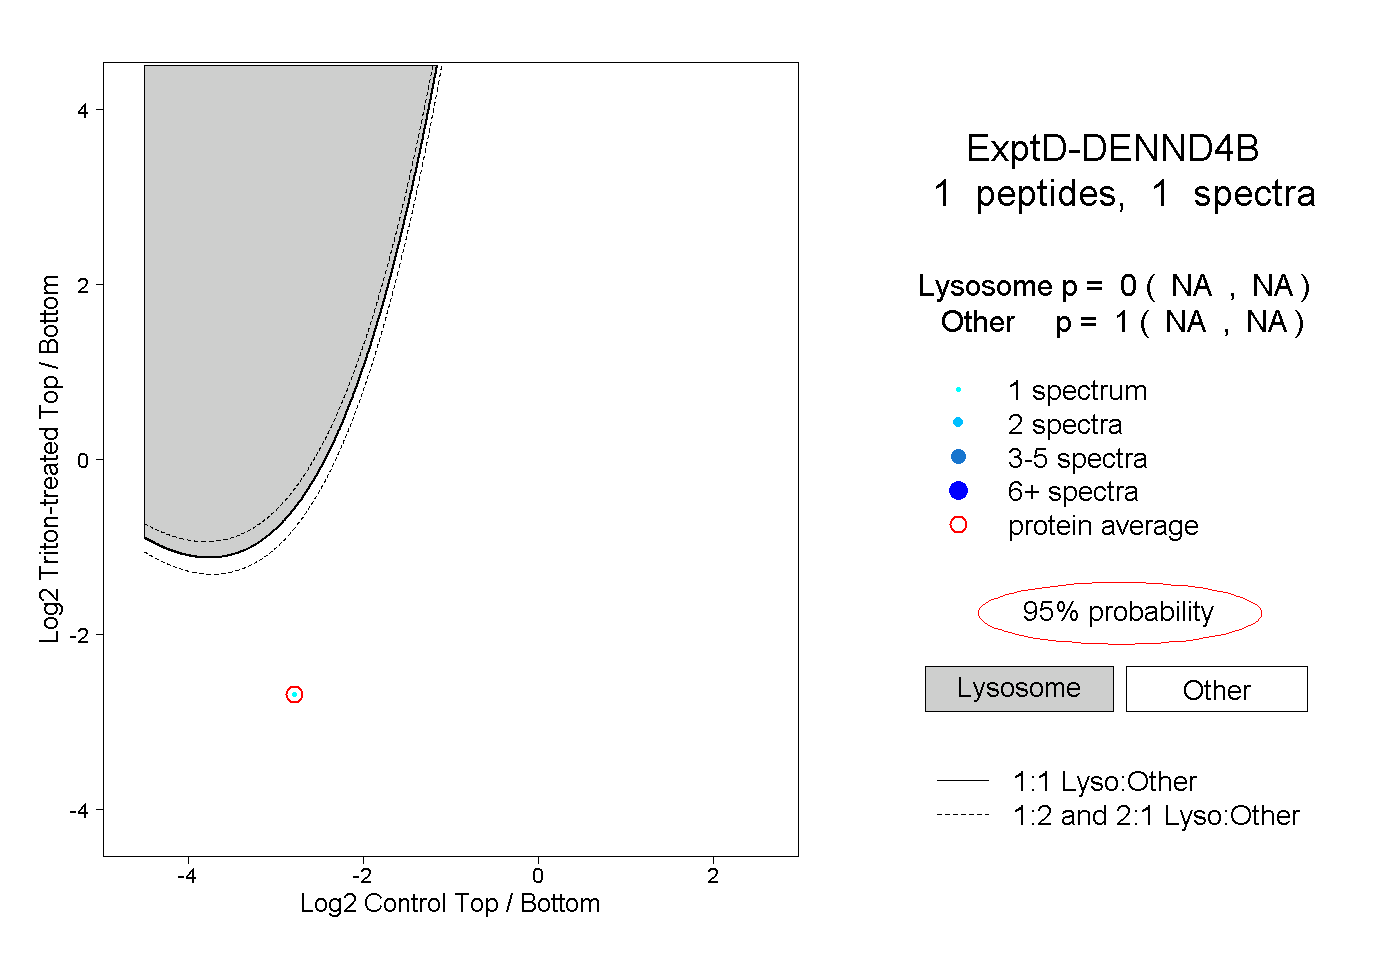
| Plot | Lyso | Other | |||||||||||
| Expt D |
1 peptide |
1 spectrum |
|
0.000 NA | NA |
1.000 NA | NA |