 8
8peptides
spectra
0.000 | 0.000
0.000 | 0.000
0.000 | 0.000
0.538 | 0.548
0.000 | 0.000
0.000 | 0.000
0.408 | 0.421
0.034 | 0.047
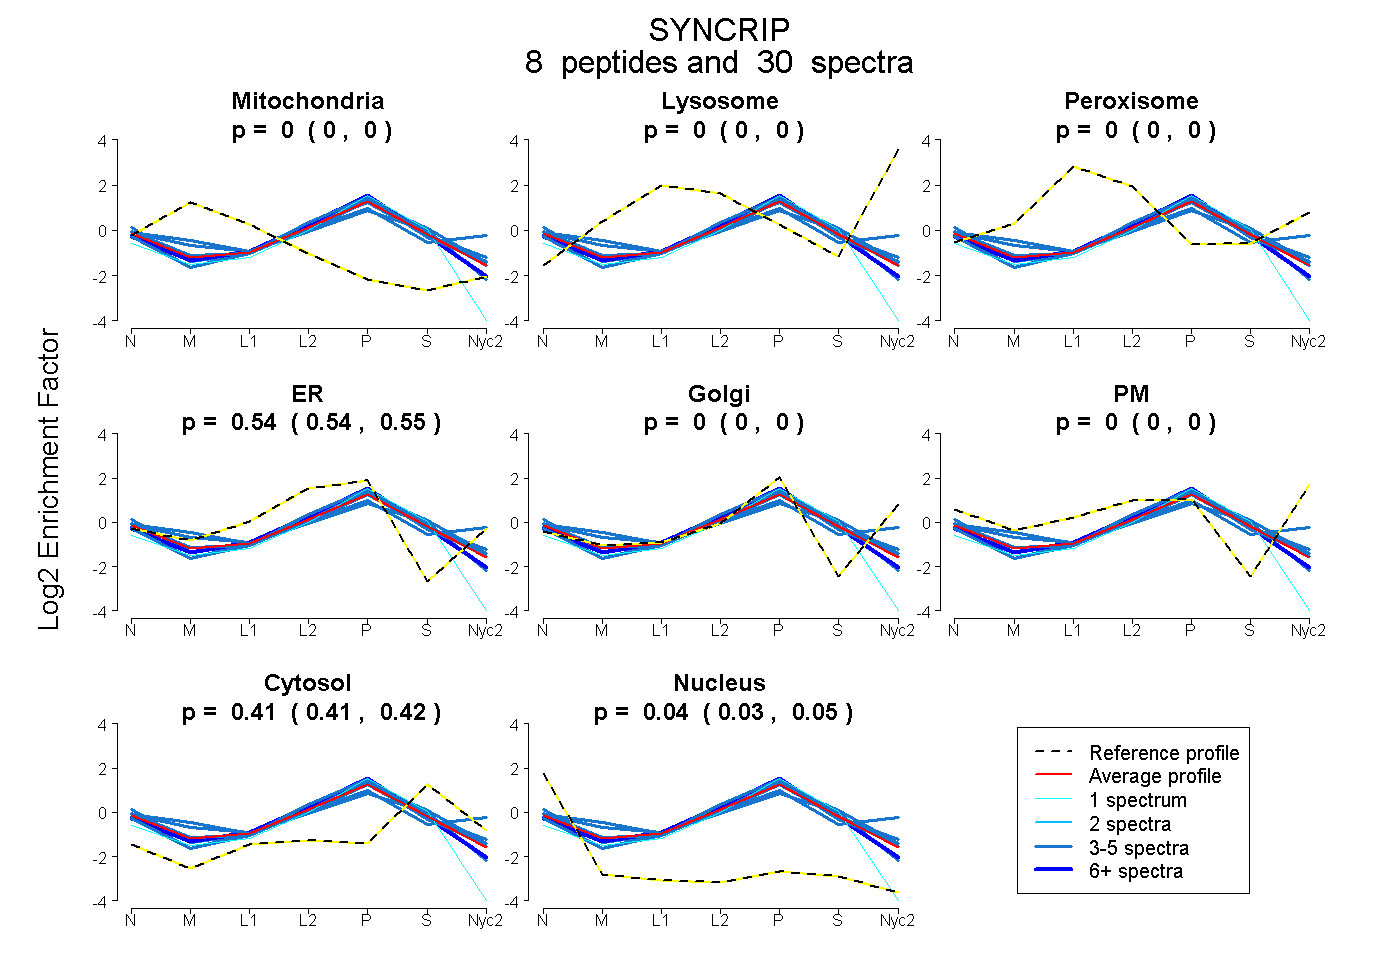
| Plot | Mito | Lyso | Perox | ER | Golgi | PM | Cytosol | Nucleus | |||||
| Expt A |
8 peptides |
30 spectra |
|
0.000 0.000 | 0.000 |
0.000 0.000 | 0.000 |
0.000 0.000 | 0.000 |
0.544 0.538 | 0.548 |
0.000 0.000 | 0.000 |
0.000 0.000 | 0.000 |
0.415 0.408 | 0.421 |
0.041 0.034 | 0.047 |
| 1 spectrum, VTEGLTDVILYHQPDDK | 0.000 | 0.000 | 0.000 | 0.447 | 0.000 | 0.000 | 0.387 | 0.166 | ||
| 8 spectra, LMMDPLTGLNR | 0.000 | 0.000 | 0.000 | 0.561 | 0.000 | 0.000 | 0.384 | 0.055 | ||
| 4 spectra, LYNNHEIR | 0.056 | 0.000 | 0.019 | 0.216 | 0.279 | 0.114 | 0.317 | 0.000 | ||
| 3 spectra, DYAFIHFDER | 0.086 | 0.000 | 0.000 | 0.446 | 0.000 | 0.000 | 0.413 | 0.056 | ||
| 3 spectra, NLANTVTEEILEK | 0.000 | 0.000 | 0.000 | 0.551 | 0.000 | 0.000 | 0.432 | 0.017 | ||
| 5 spectra, EQILEEFSK | 0.000 | 0.000 | 0.000 | 0.563 | 0.000 | 0.000 | 0.404 | 0.033 | ||
| 3 spectra, SFSQFGK | 0.000 | 0.000 | 0.000 | 0.566 | 0.000 | 0.000 | 0.388 | 0.045 | ||
| 3 spectra, DLFEDELVPLFEK | 0.000 | 0.000 | 0.000 | 0.494 | 0.000 | 0.000 | 0.490 | 0.016 |
| Plot | Mito | Lyso or Perox | ER | Golgi | PM | Cytosol | Nucleus | ||||||
| Expt B |
9 peptides |
28 spectra |
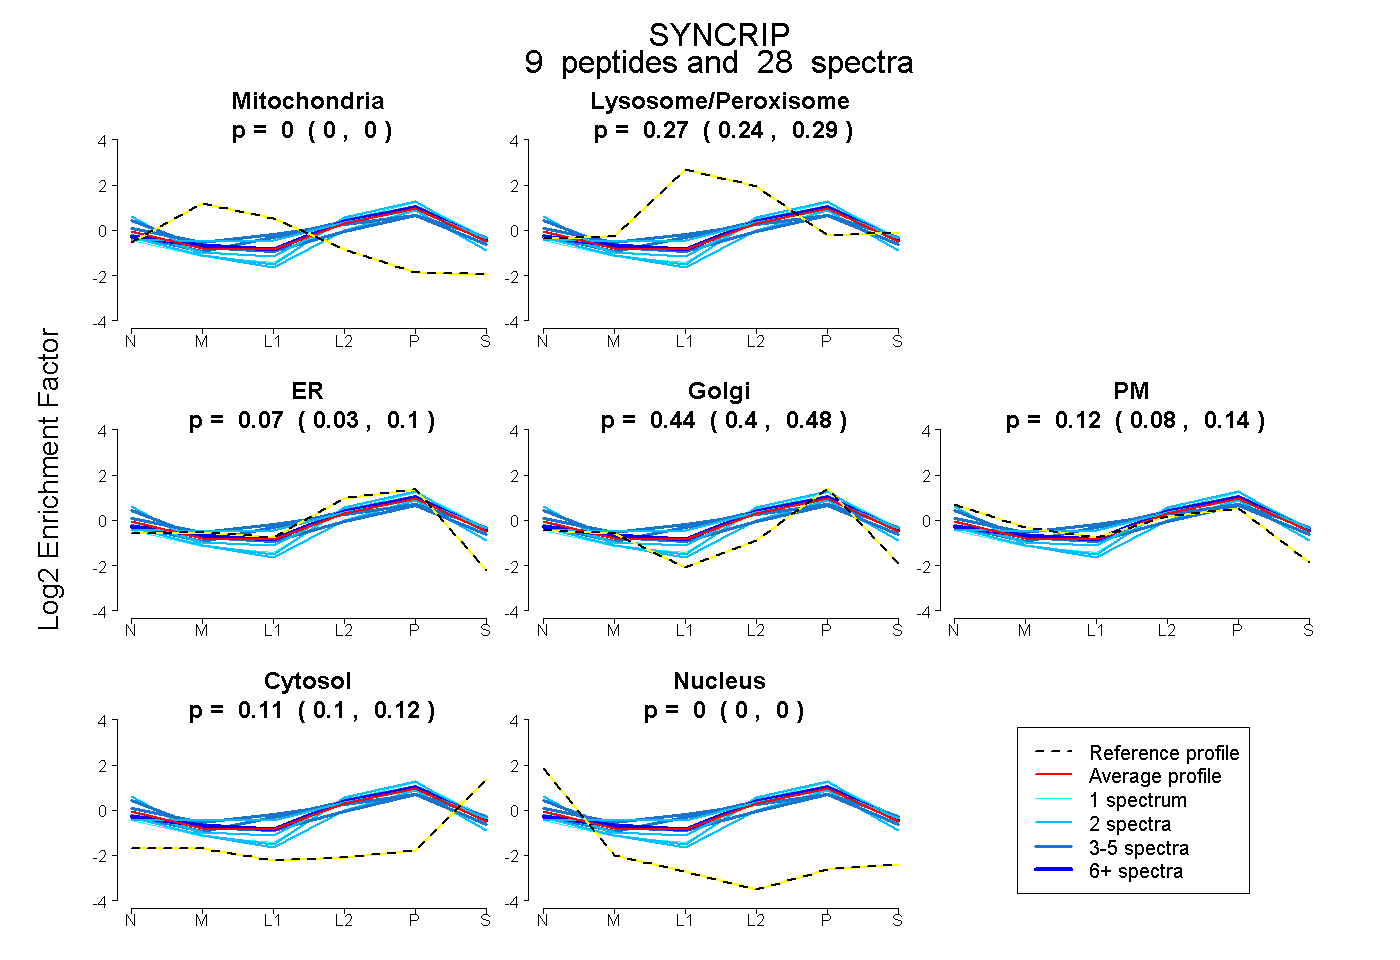 |
0.000 0.000 | 0.000 |
0.265 0.242 | 0.285 |
0.066 0.027 | 0.101 |
0.442 0.402 | 0.476 |
0.115 0.083 | 0.142 |
0.112 0.100 | 0.123 |
0.000 0.000 | 0.000 |
|||
| Plot | Lyso | Other | |||||||||||
| Expt C |
12 peptides |
64 spectra |
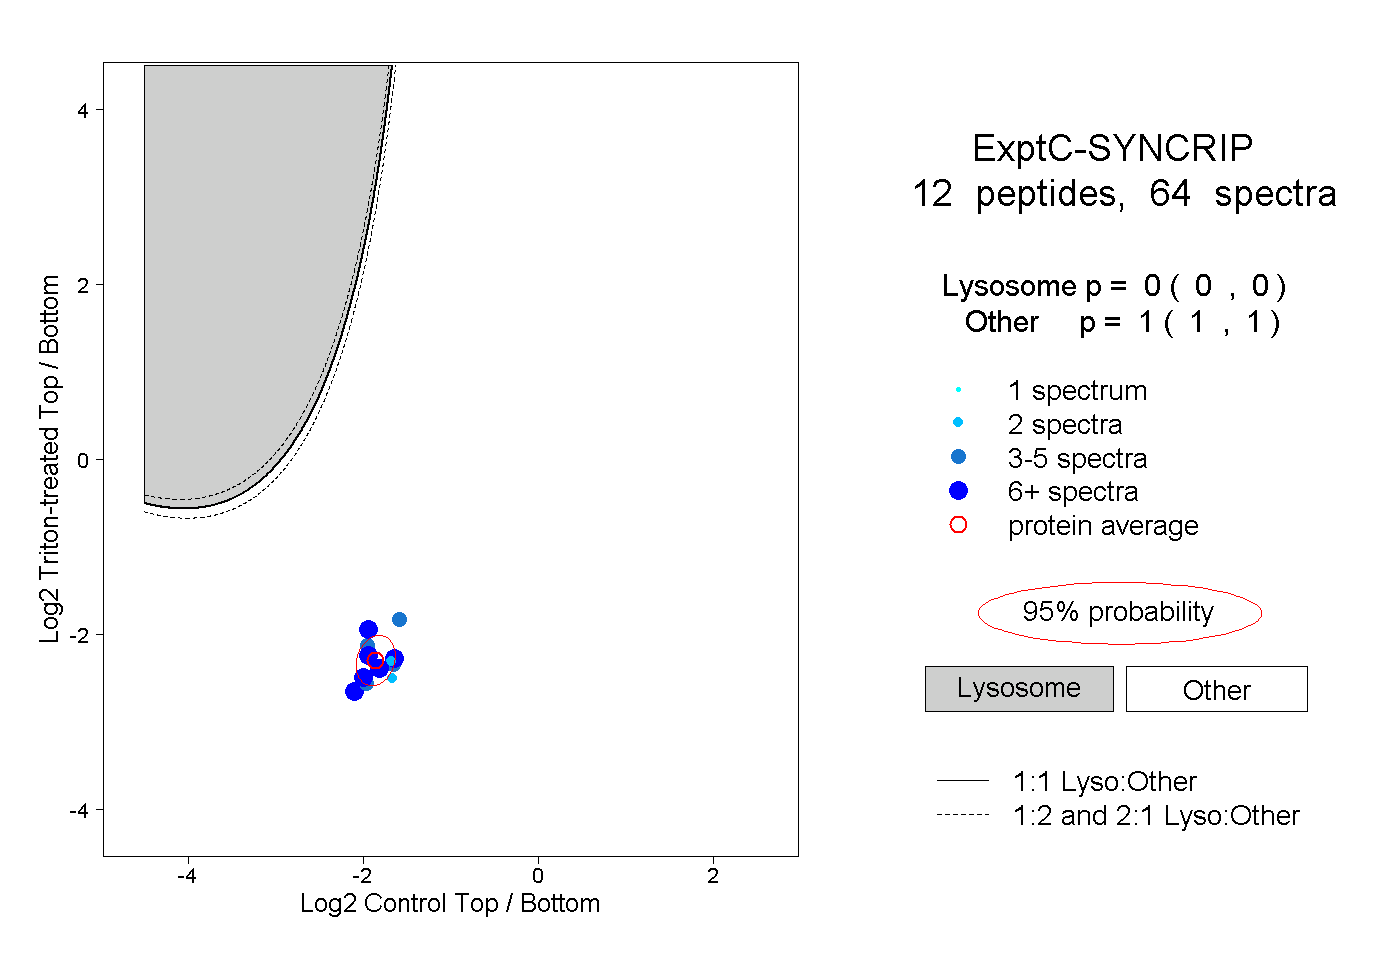 |
0.000 0.000 | 0.000 |
1.000 1.000 | 1.000 |
||||||||
| Plot | Lyso | Other | |||||||||||
| Expt D |
1 peptide |
5 spectra |
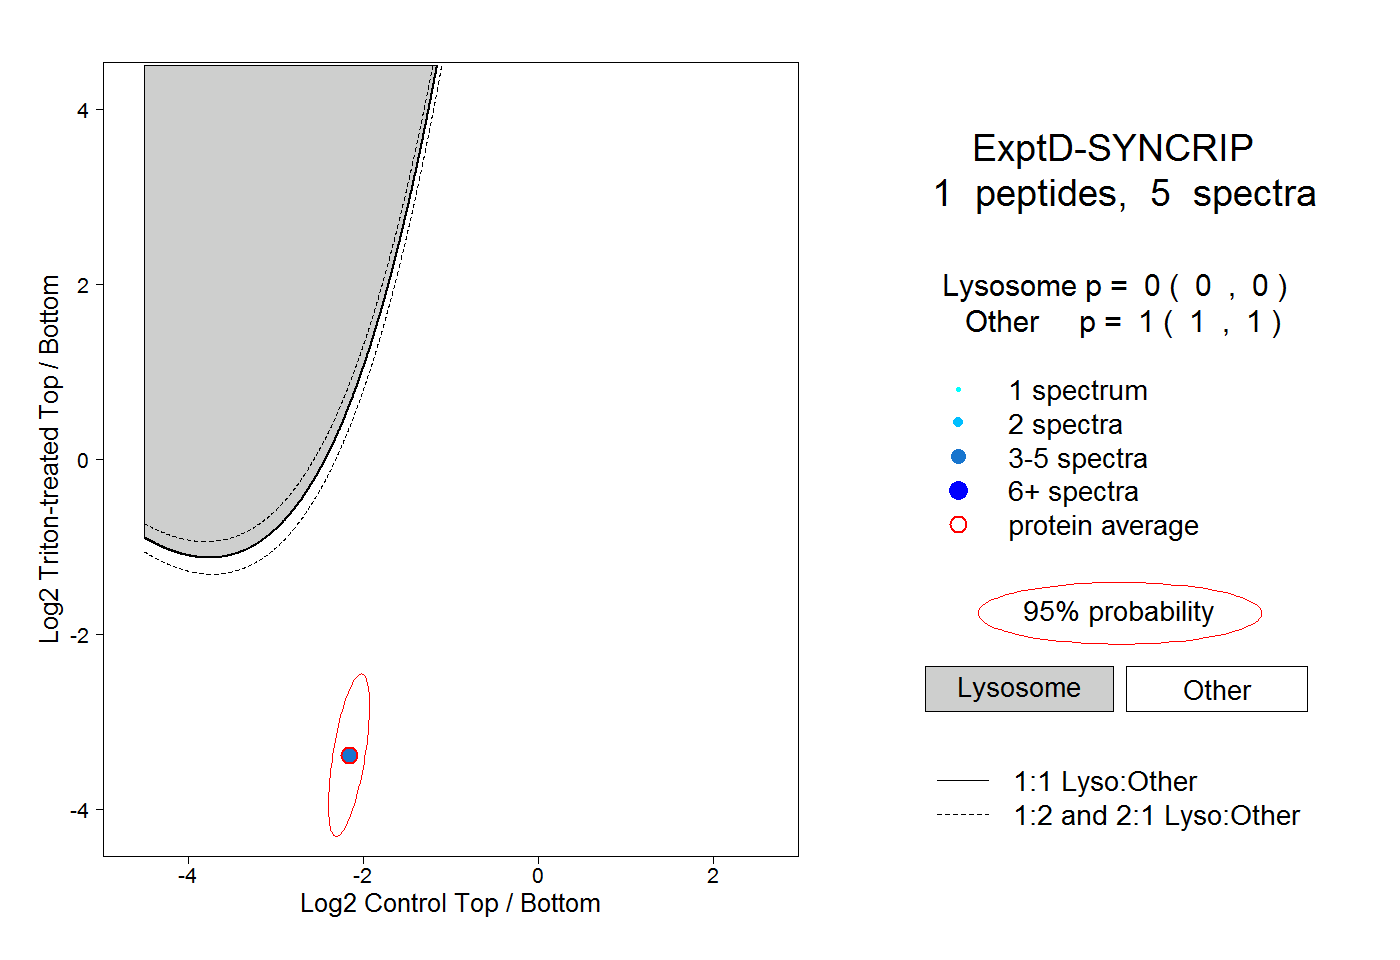 |
0.000 0.000 | 0.000 |
1.000 1.000 | 1.000 |