 19
19peptides
spectra
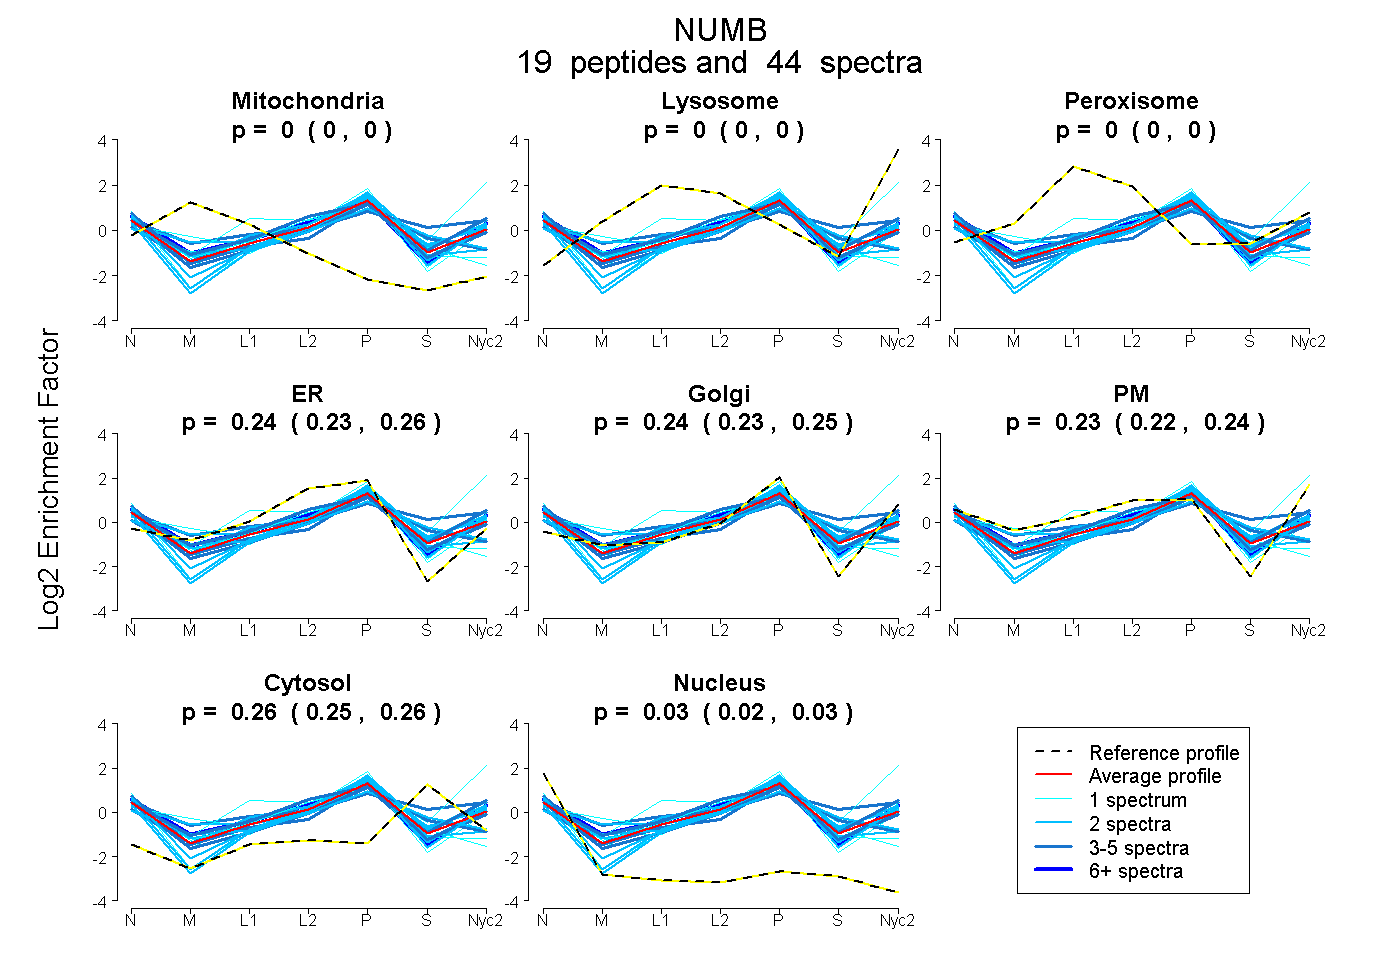
0.000 | 0.000
0.000 | 0.000
0.000 | 0.000
0.226 | 0.256
0.228 | 0.252
0.217 | 0.241
0.252 | 0.265
0.023 | 0.031
4peptides
spectra
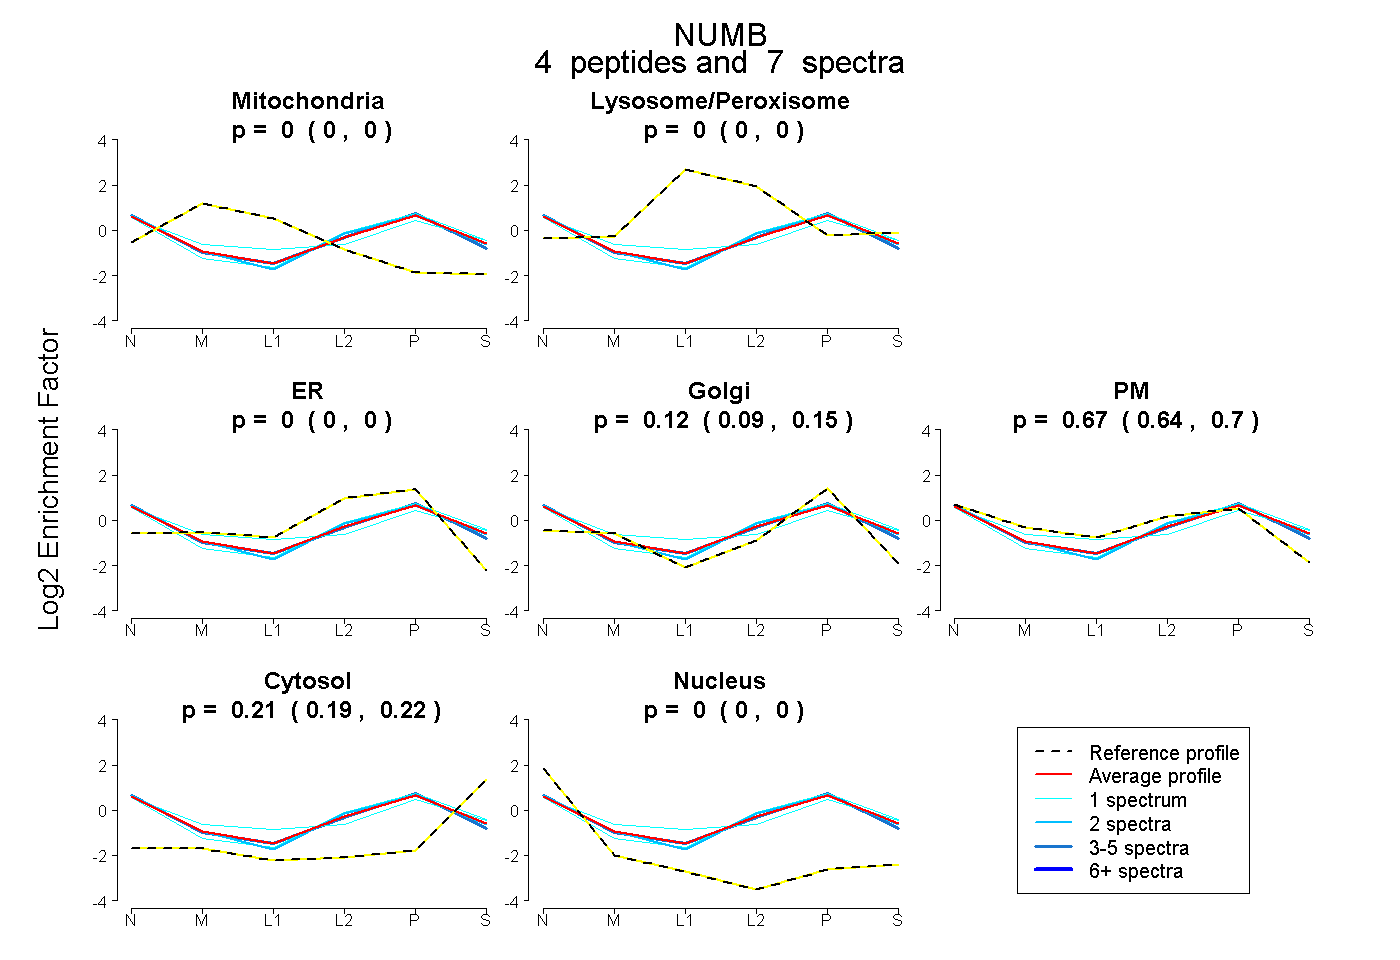
0.000 | 0.000
0.000 | 0.000
0.000 | 0.000
0.086 | 0.151
0.638 | 0.702
0.193 | 0.216
0.000 | 0.000
10peptides
spectra
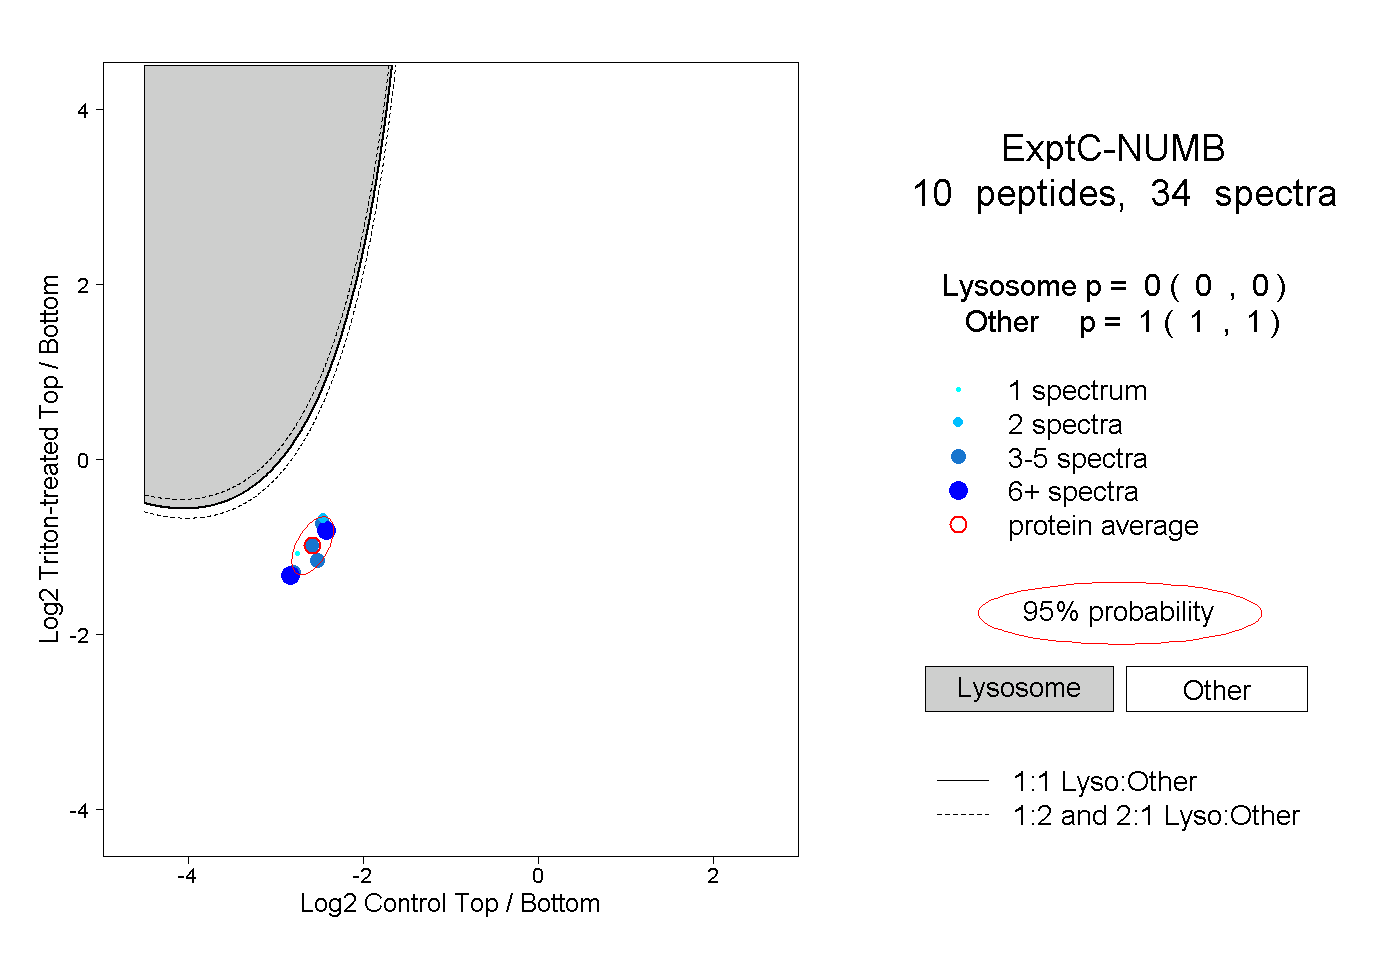
0.000 | 0.000
1.000 | 1.000
2peptides
spectra
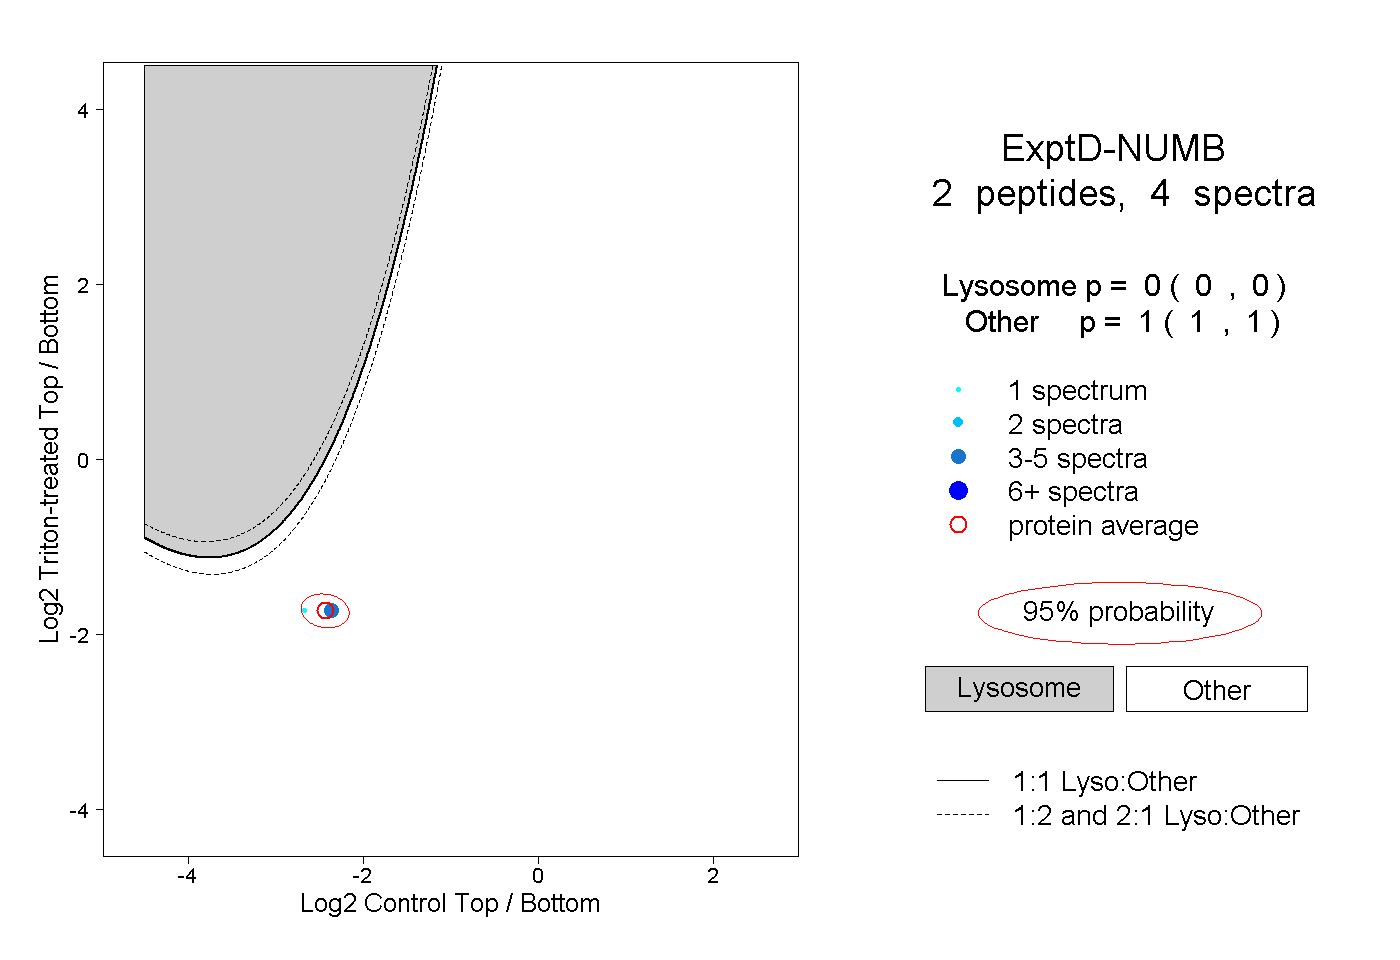
0.000 | 0.000
1.000 | 1.000