 2
2peptides
spectra
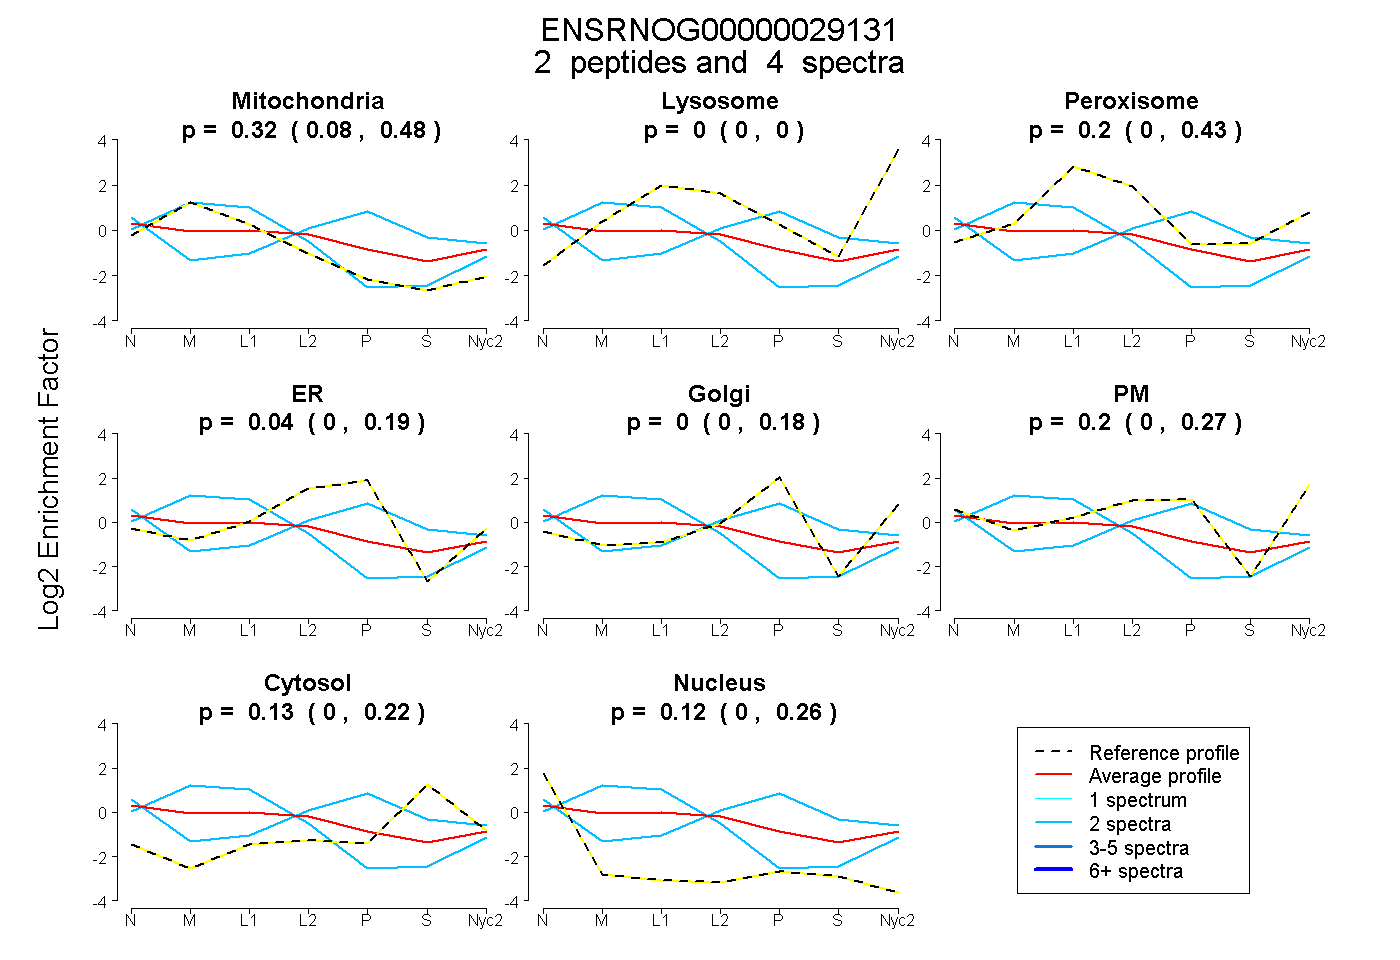
0.076 | 0.480
0.000 | 0.000
0.000 | 0.431
0.000 | 0.191
0.000 | 0.185
0.000 | 0.273
0.000 | 0.219
0.000 | 0.260
2peptides
spectra
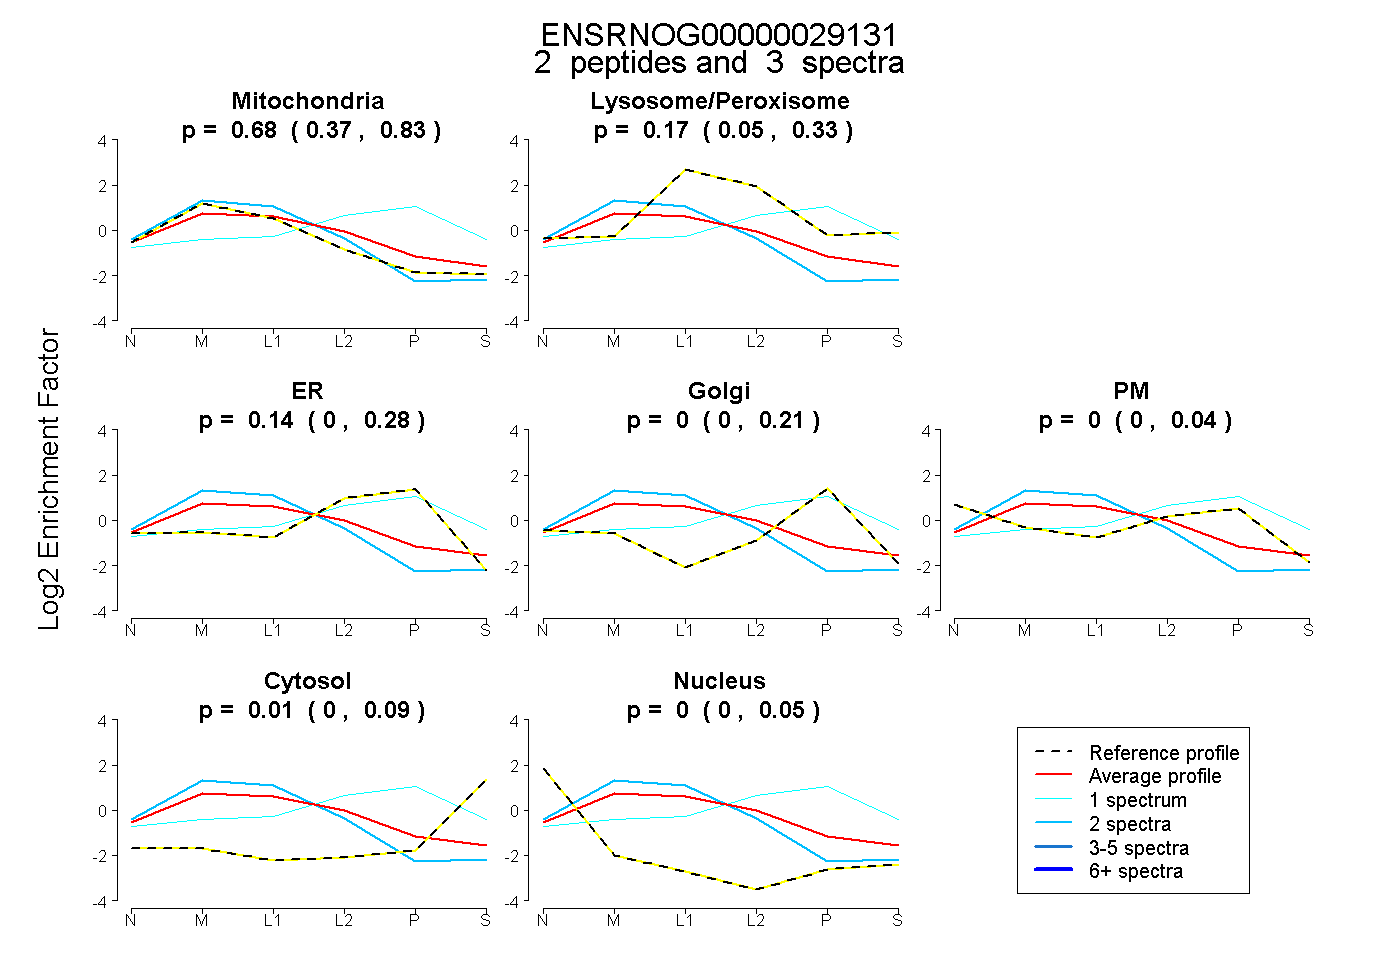
0.373 | 0.832
0.052 | 0.326
0.000 | 0.282
0.000 | 0.208
0.000 | 0.041
0.000 | 0.095
0.000 | 0.055
2peptides
spectra
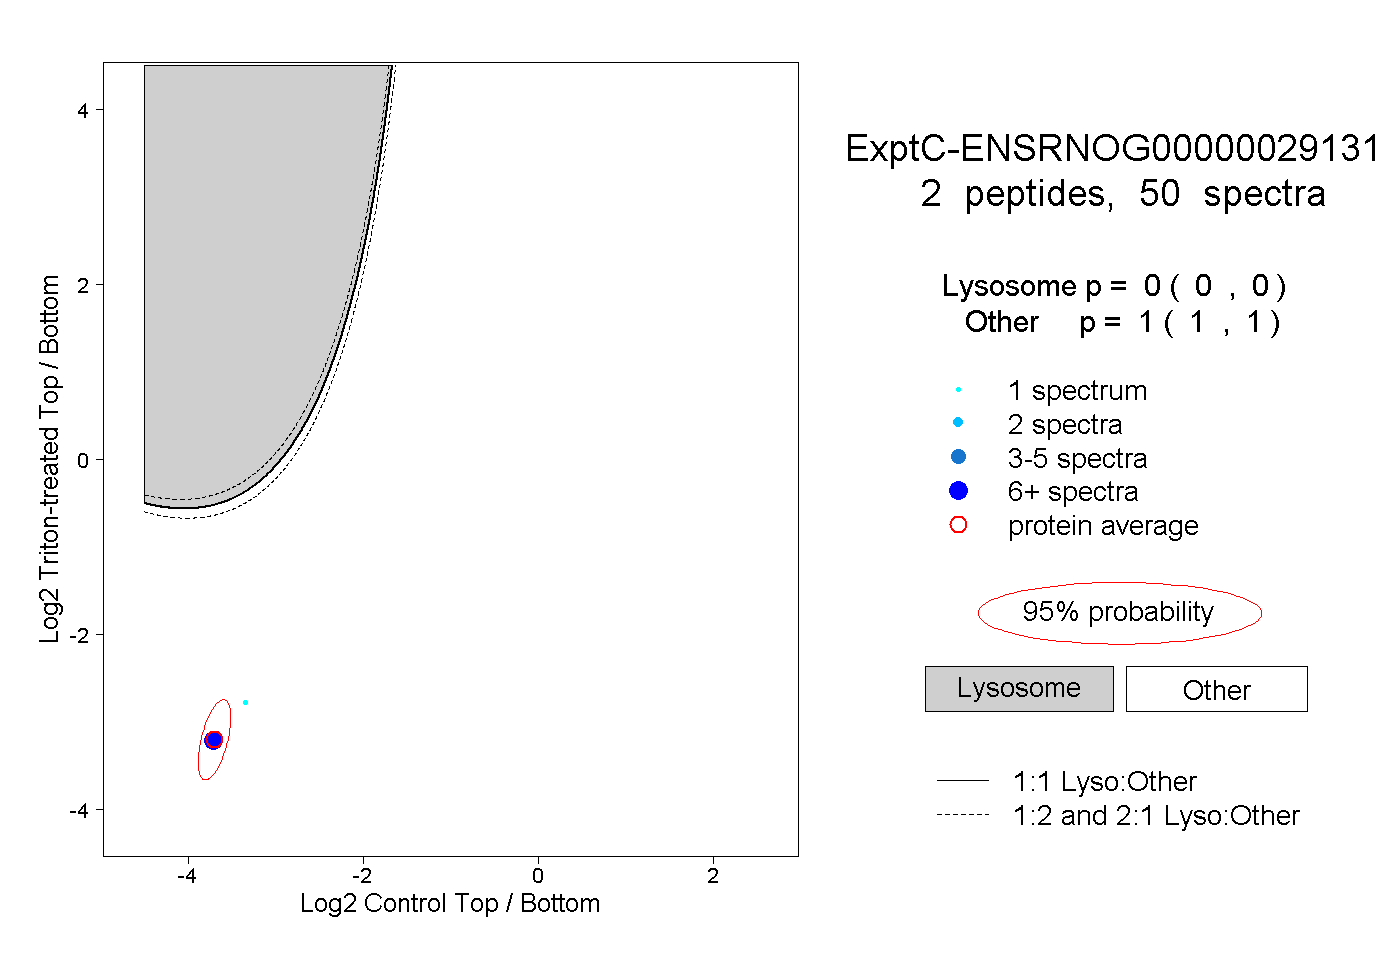
0.000 | 0.000
1.000 | 1.000
1peptide
spectra
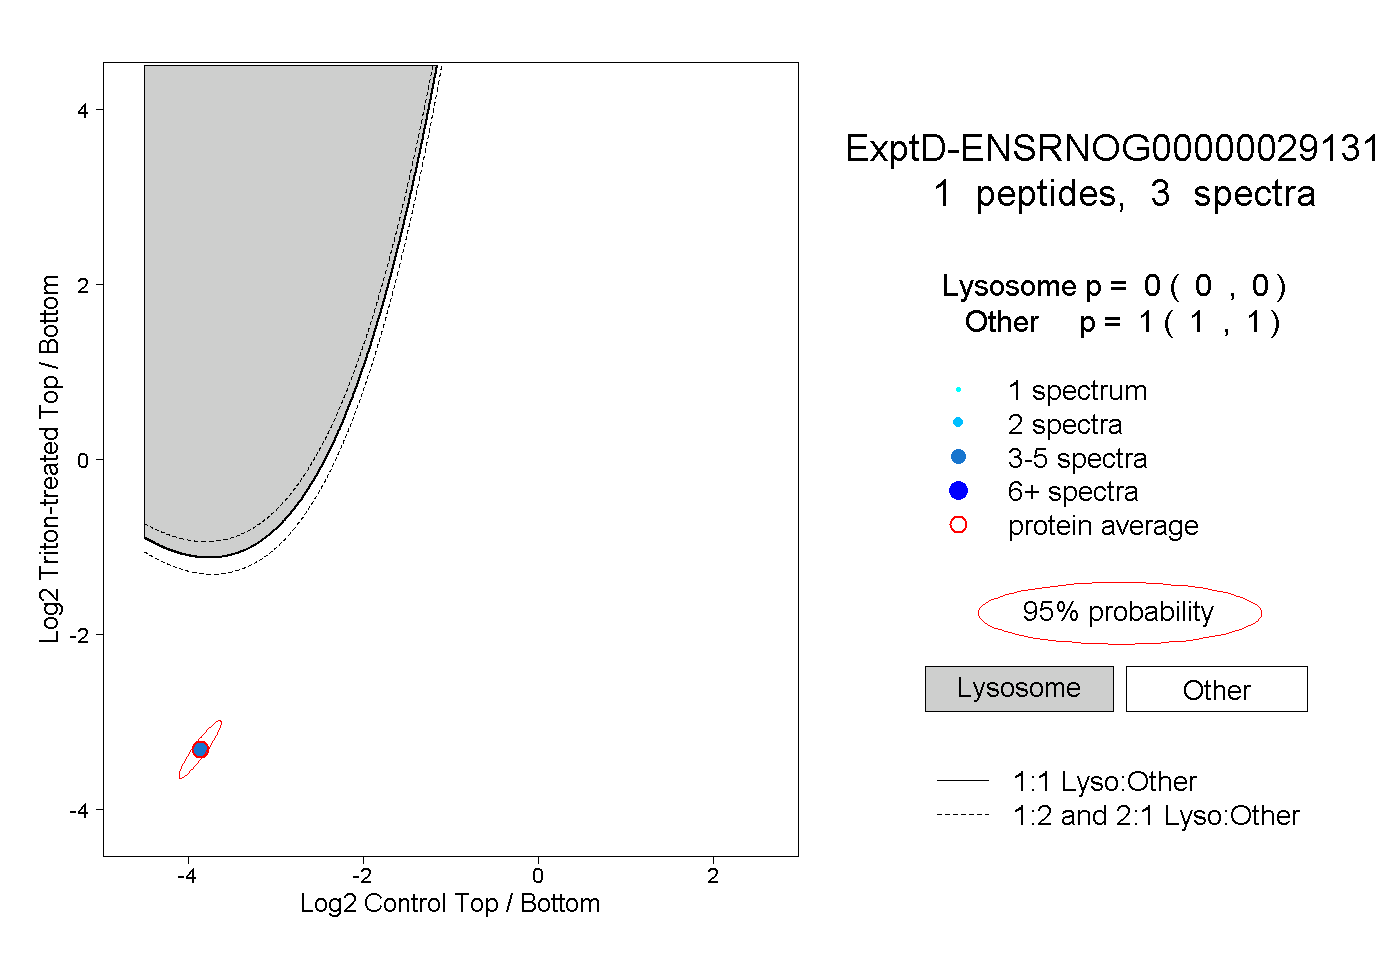
0.000 | 0.000
1.000 | 1.000