 3
3peptides
spectra
0.000 | 0.000
0.000 | 0.056
0.000 | 0.000
0.000 | 0.115
0.215 | 0.368
0.271 | 0.426
0.244 | 0.302
0.000 | 0.000
1peptide
spectra
0.005 | 0.346
0.650 | 0.995
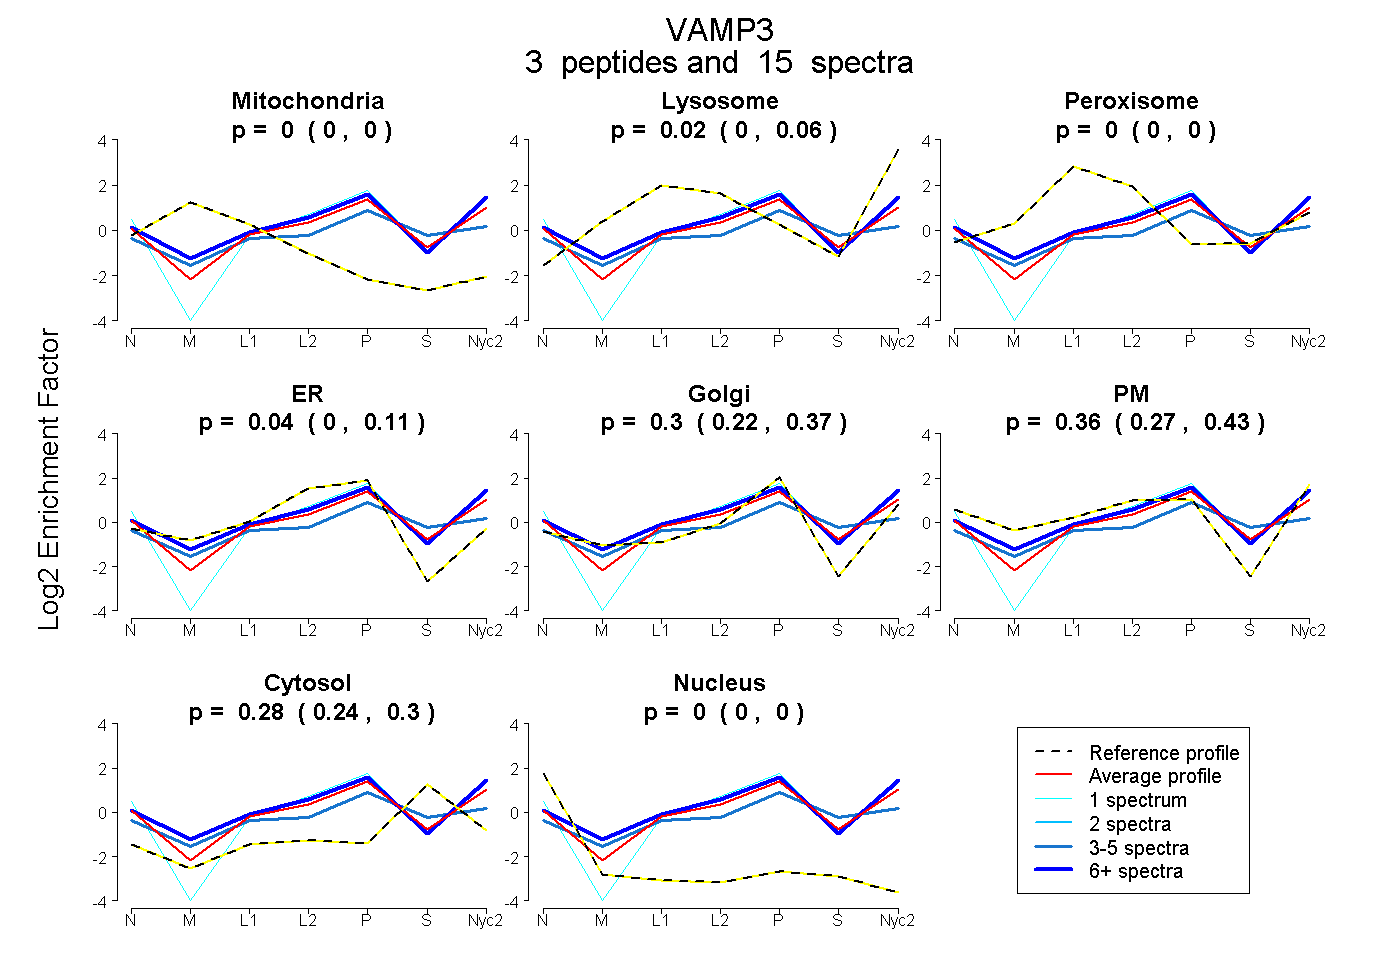
| Plot | Mito | Lyso | Perox | ER | Golgi | PM | Cytosol | Nucleus | |||||
| Expt A |
3 peptides |
15 spectra |
|
0.000 0.000 | 0.000 |
0.022 0.000 | 0.056 |
0.000 0.000 | 0.000 |
0.036 0.000 | 0.115 |
0.303 0.215 | 0.368 |
0.363 0.271 | 0.426 |
0.276 0.244 | 0.302 |
0.000 0.000 | 0.000 |
||
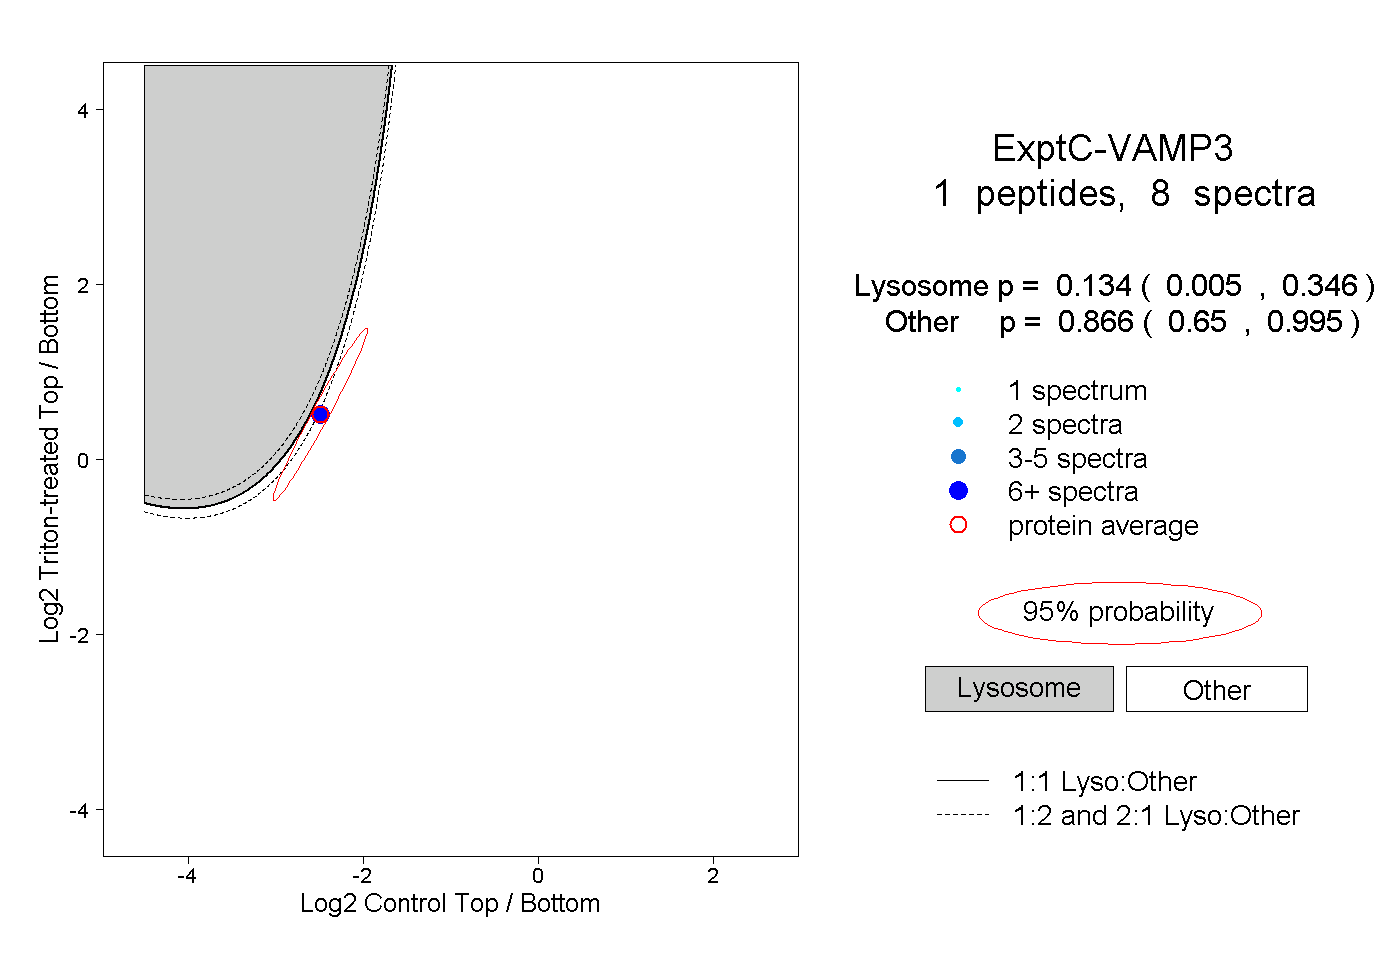
| Plot | Lyso | Other | |||||||||||
| Expt C |
1 peptide |
8 spectra |
|
0.134 0.005 | 0.346 |
0.866 0.650 | 0.995 |