 14
14peptides
spectra
0.000 | 0.000
0.000 | 0.000
0.000 | 0.000
0.376 | 0.377
0.000 | 0.000
0.000 | 0.000
0.243 | 0.245
0.378 | 0.380
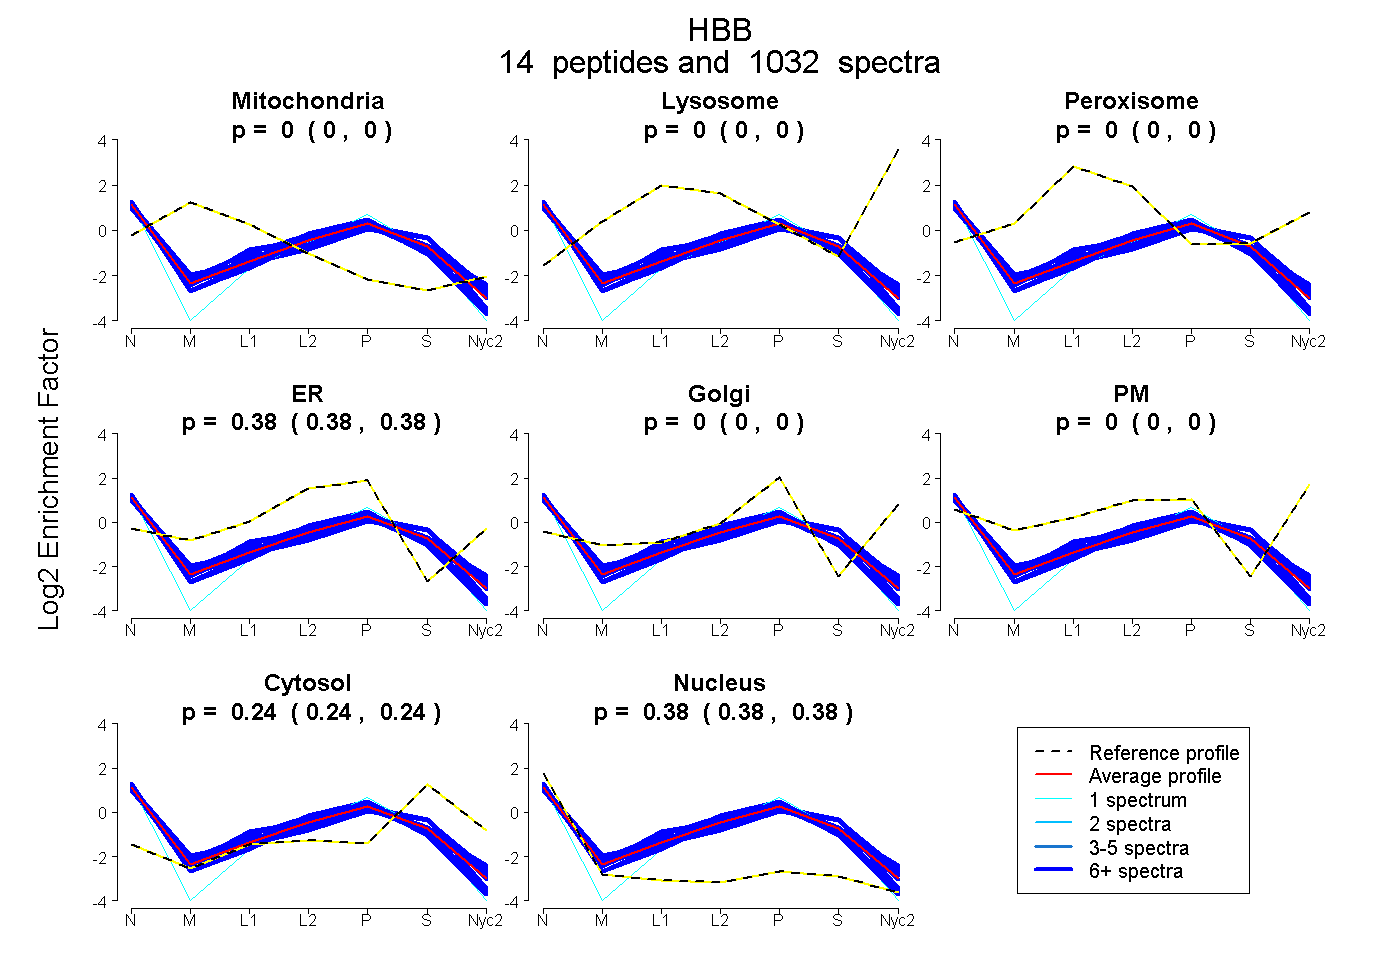
| Plot | Mito | Lyso | Perox | ER | Golgi | PM | Cytosol | Nucleus | |||||
| Expt A |
14 peptides |
1032 spectra |
|
0.000 0.000 | 0.000 |
0.000 0.000 | 0.000 |
0.000 0.000 | 0.000 |
0.377 0.376 | 0.377 |
0.000 0.000 | 0.000 |
0.000 0.000 | 0.000 |
0.244 0.243 | 0.245 |
0.379 0.378 | 0.380 |
| 87 spectra, LHVDPENFR | 0.000 | 0.000 | 0.000 | 0.341 | 0.000 | 0.000 | 0.337 | 0.322 | ||
| 33 spectra, EFTPCAQAAFQK | 0.000 | 0.000 | 0.000 | 0.317 | 0.000 | 0.000 | 0.330 | 0.353 | ||
| 95 spectra, LLVVYPWTQR | 0.000 | 0.000 | 0.000 | 0.384 | 0.000 | 0.000 | 0.153 | 0.463 | ||
| 72 spectra, VVAGVASALAHK | 0.000 | 0.000 | 0.000 | 0.404 | 0.000 | 0.000 | 0.223 | 0.373 | ||
| 1 spectrum, LLGNMIVIVLGHHLGK | 0.000 | 0.000 | 0.000 | 0.312 | 0.000 | 0.000 | 0.197 | 0.491 | ||
| 18 spectra, EFSPCAQAAFQK | 0.000 | 0.000 | 0.000 | 0.281 | 0.000 | 0.000 | 0.315 | 0.404 | ||
| 56 spectra, VINAFNDGLK | 0.000 | 0.000 | 0.000 | 0.442 | 0.000 | 0.000 | 0.189 | 0.369 | ||
| 13 spectra, GTFAHLSELHCDK | 0.000 | 0.000 | 0.000 | 0.334 | 0.000 | 0.000 | 0.340 | 0.326 | ||
| 312 spectra, HLDNLK | 0.000 | 0.000 | 0.000 | 0.359 | 0.000 | 0.000 | 0.195 | 0.446 | ||
| 215 spectra, VNPDDVGGEALGR | 0.000 | 0.000 | 0.000 | 0.357 | 0.000 | 0.000 | 0.170 | 0.473 | ||
| 48 spectra, VHLTDAEK | 0.000 | 0.000 | 0.000 | 0.453 | 0.000 | 0.000 | 0.245 | 0.301 | ||
| 41 spectra, AAVNGLWGK | 0.000 | 0.000 | 0.000 | 0.450 | 0.000 | 0.000 | 0.216 | 0.333 | ||
| 21 spectra, VINAFDDGLK | 0.000 | 0.000 | 0.000 | 0.374 | 0.000 | 0.000 | 0.236 | 0.389 | ||
| 20 spectra, YFDSFGDLSSASAIMGNPK | 0.000 | 0.000 | 0.000 | 0.404 | 0.000 | 0.000 | 0.262 | 0.334 |
| Plot | Mito | Lyso or Perox | ER | Golgi | PM | Cytosol | Nucleus | ||||||
| Expt B |
13 peptides |
279 spectra |
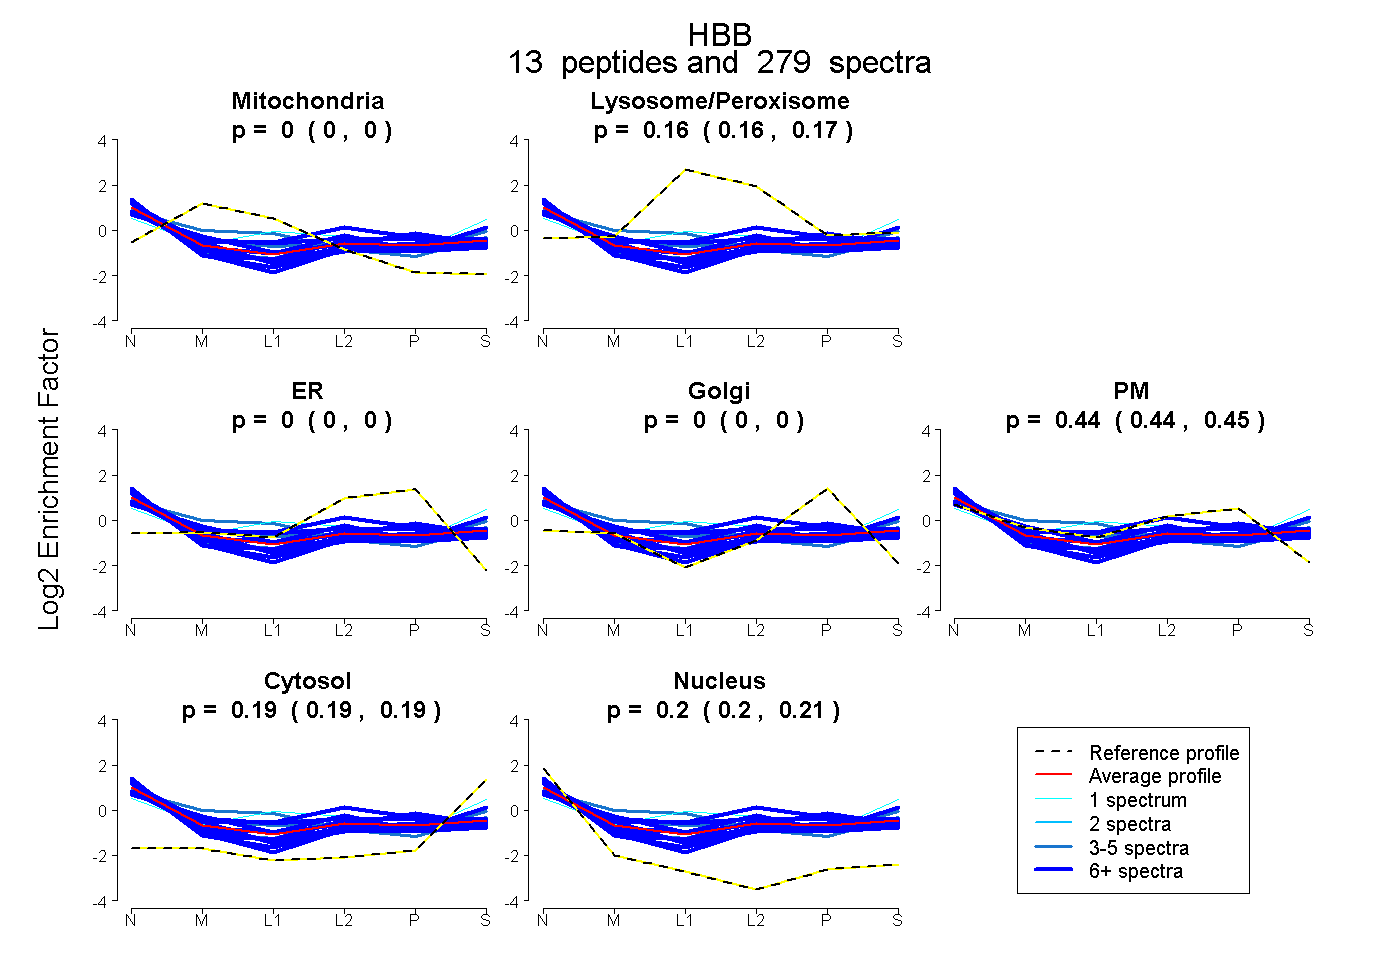 |
0.000 0.000 | 0.000 |
0.164 0.161 | 0.168 |
0.000 0.000 | 0.000 |
0.000 0.000 | 0.000 |
0.443 0.438 | 0.447 |
0.190 0.187 | 0.192 |
0.203 0.201 | 0.206 |
|||
| Plot | Lyso | Other | |||||||||||
| Expt C |
11 peptides |
578 spectra |
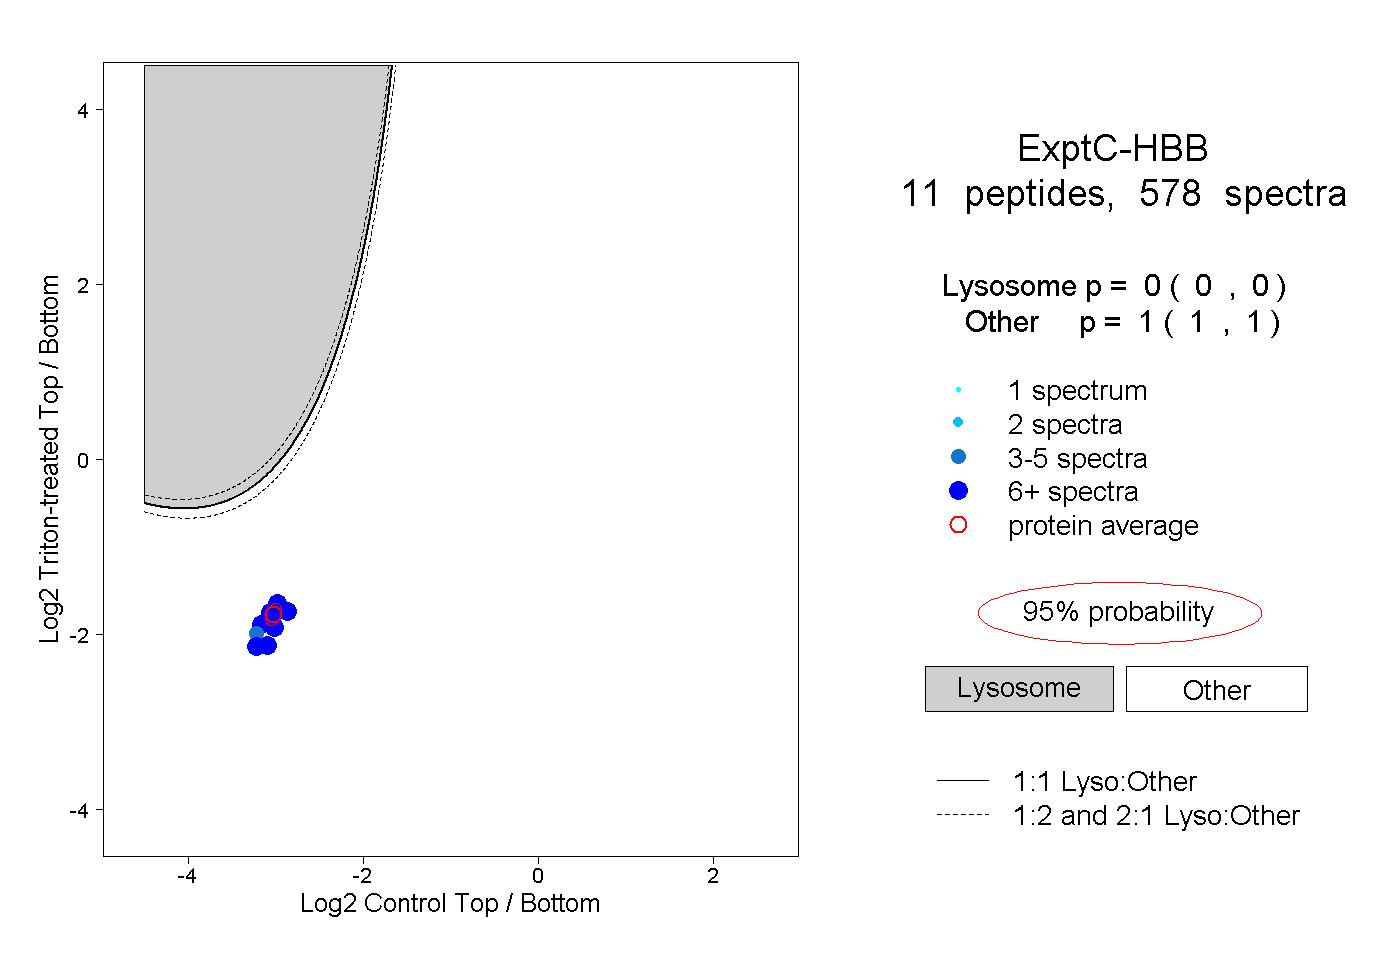 |
0.000 0.000 | 0.000 |
1.000 1.000 | 1.000 |
||||||||
| Plot | Lyso | Other | |||||||||||
| Expt D |
8 peptides |
106 spectra |
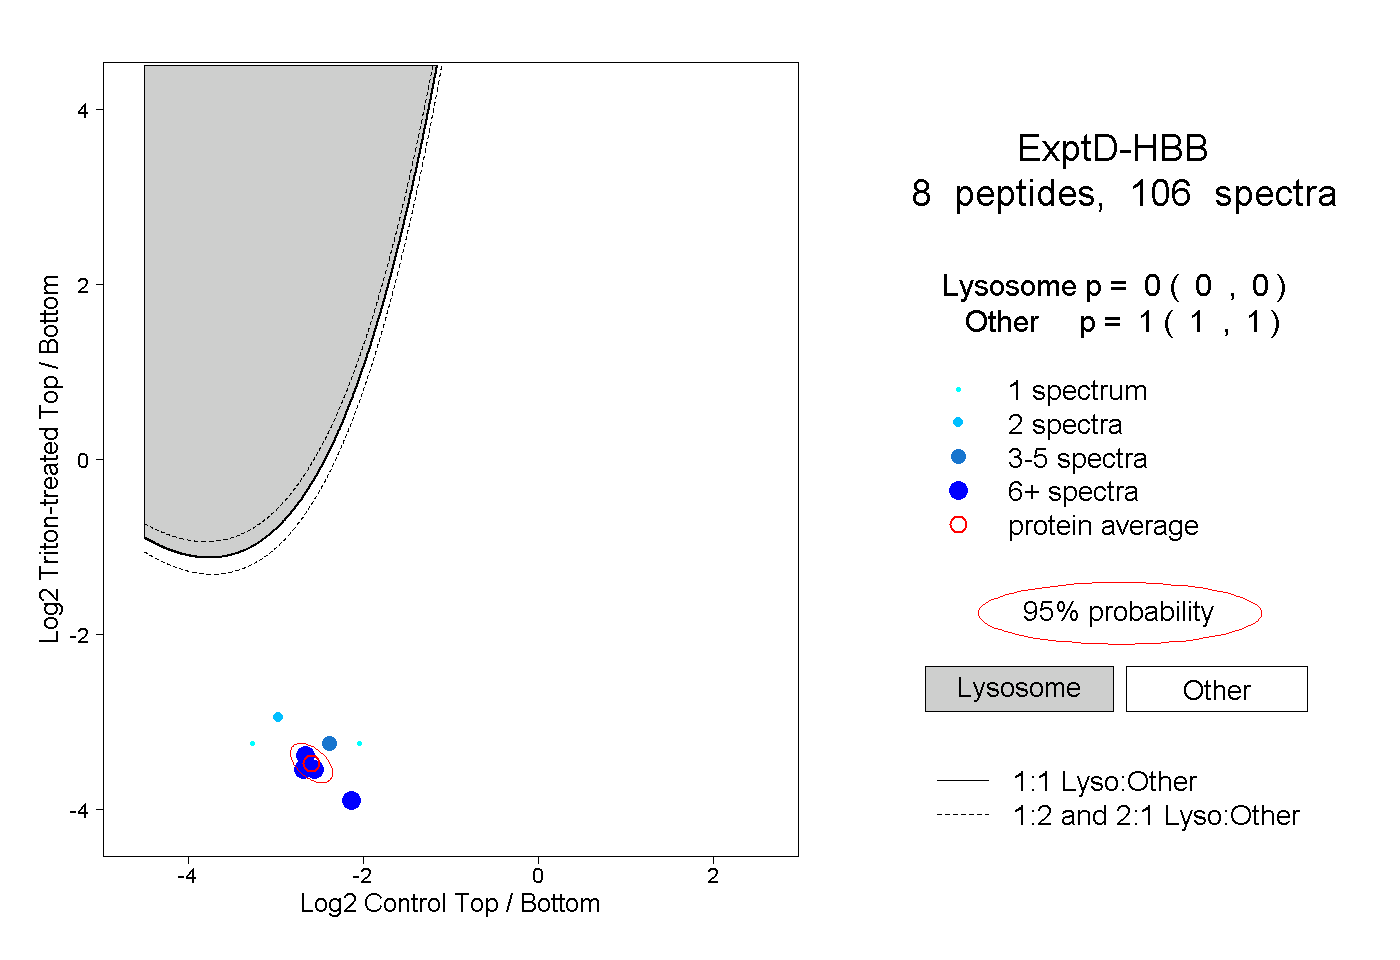 |
0.000 0.000 | 0.000 |
1.000 1.000 | 1.000 |