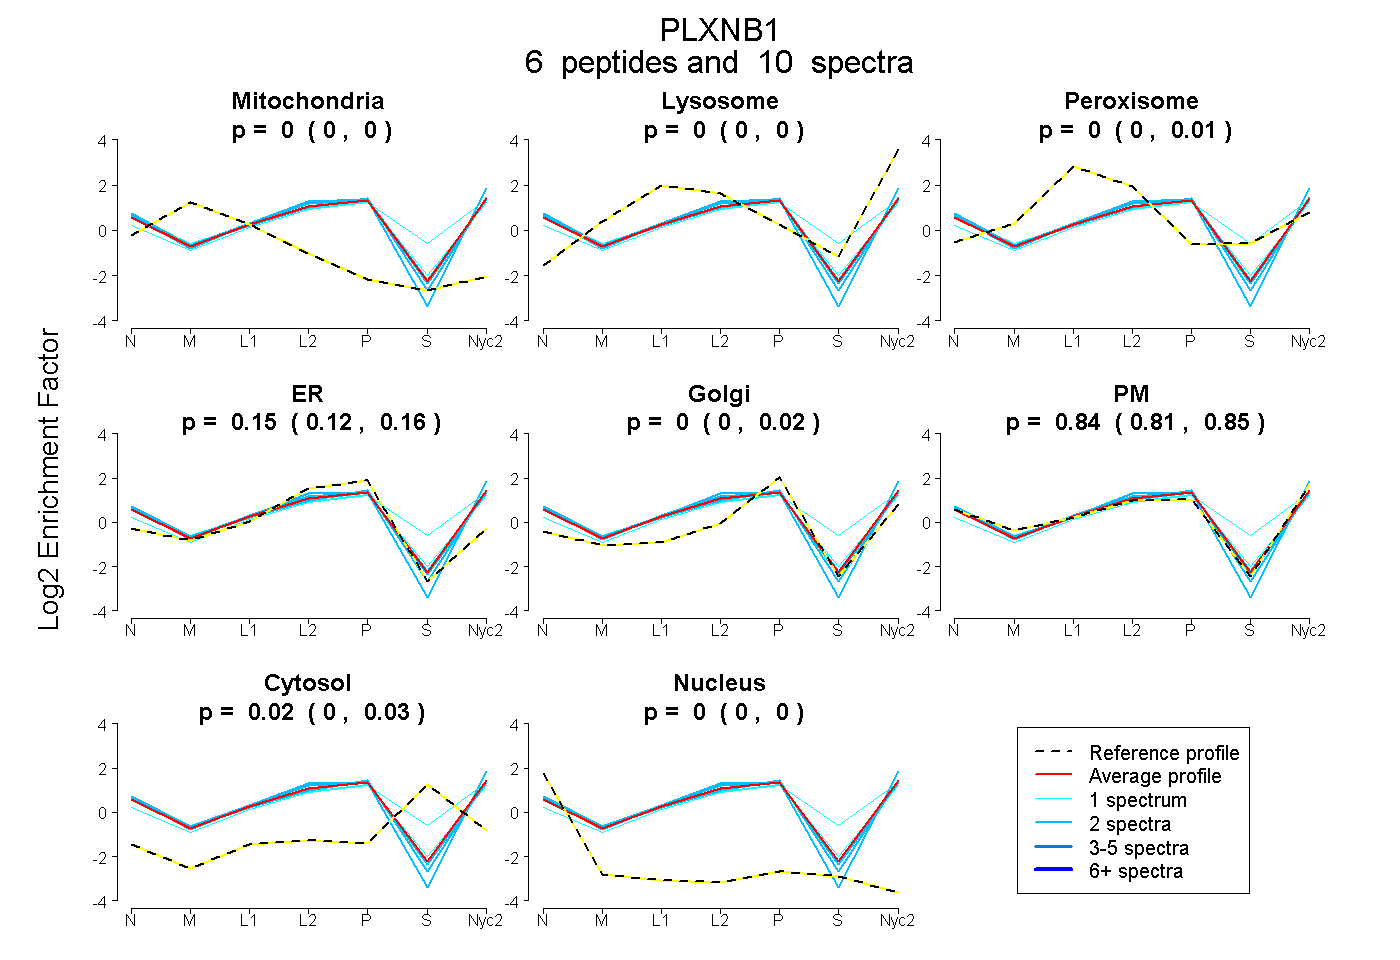
 6
6peptides
spectra
0.000 | 0.000
0.000 | 0.000
0.000 | 0.009
0.116 | 0.164
0.000 | 0.023
0.815 | 0.853
0.000 | 0.033
0.000 | 0.000
10peptides
spectra
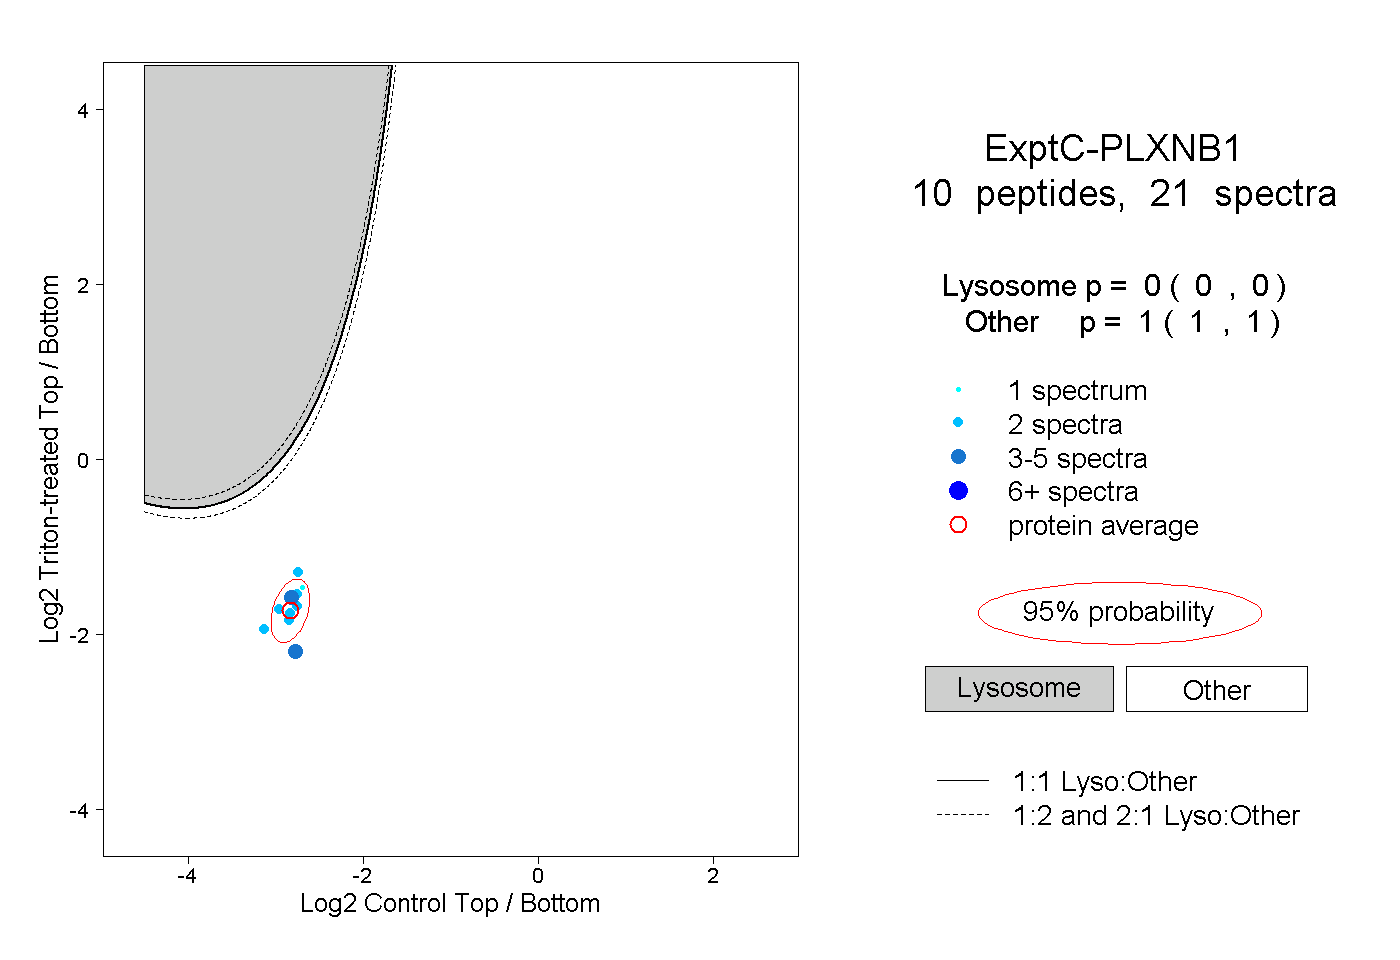
0.000 | 0.000
1.000 | 1.000
| Plot | Mito | Lyso | Perox | ER | Golgi | PM | Cytosol | Nucleus | |||||
| Expt A |
6 peptides |
10 spectra |
|
0.000 0.000 | 0.000 |
0.000 0.000 | 0.000 |
0.000 0.000 | 0.009 |
0.145 0.116 | 0.164 |
0.000 0.000 | 0.023 |
0.839 0.815 | 0.853 |
0.016 0.000 | 0.033 |
0.000 0.000 | 0.000 |
||
| Plot | Lyso | Other | |||||||||||
| Expt C |
10 peptides |
21 spectra |
|
0.000 0.000 | 0.000 |
1.000 1.000 | 1.000 |