 2
2peptides
spectra
0.000 | 0.000
0.173 | 0.250
0.000 | 0.000
0.000 | 0.000
0.000 | 0.058
0.459 | 0.571
0.217 | 0.272
0.000 | 0.000
1peptide
spectrum
NA | NA
NA | NA
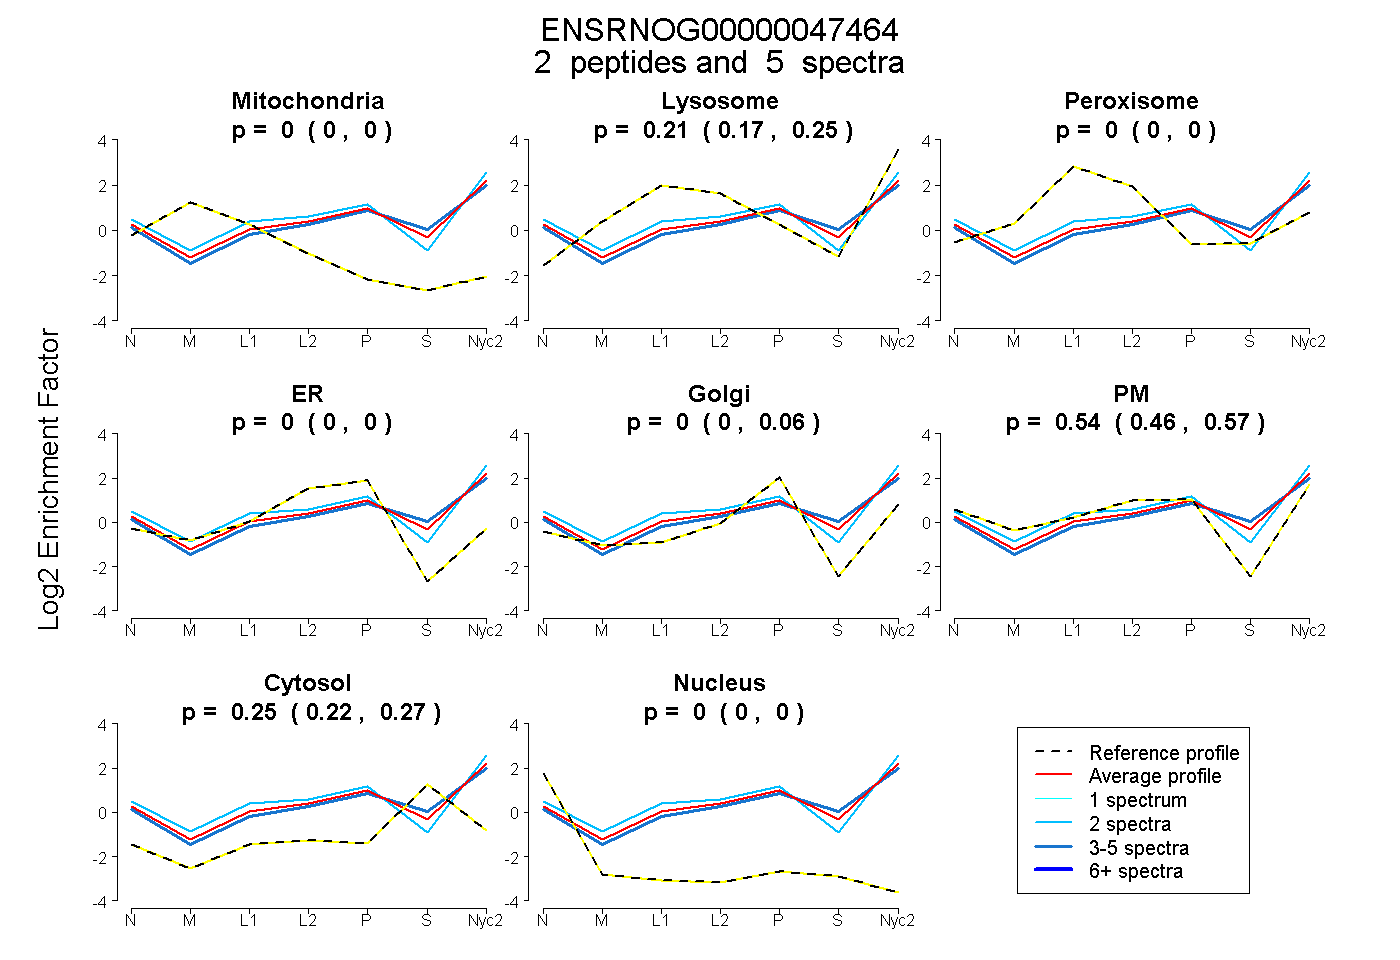
| Plot | Mito | Lyso | Perox | ER | Golgi | PM | Cytosol | Nucleus | |||||
| Expt A |
2 peptides |
5 spectra |
|
0.000 0.000 | 0.000 |
0.212 0.173 | 0.250 |
0.000 0.000 | 0.000 |
0.000 0.000 | 0.000 |
0.000 0.000 | 0.058 |
0.537 0.459 | 0.571 |
0.251 0.217 | 0.272 |
0.000 0.000 | 0.000 |
||
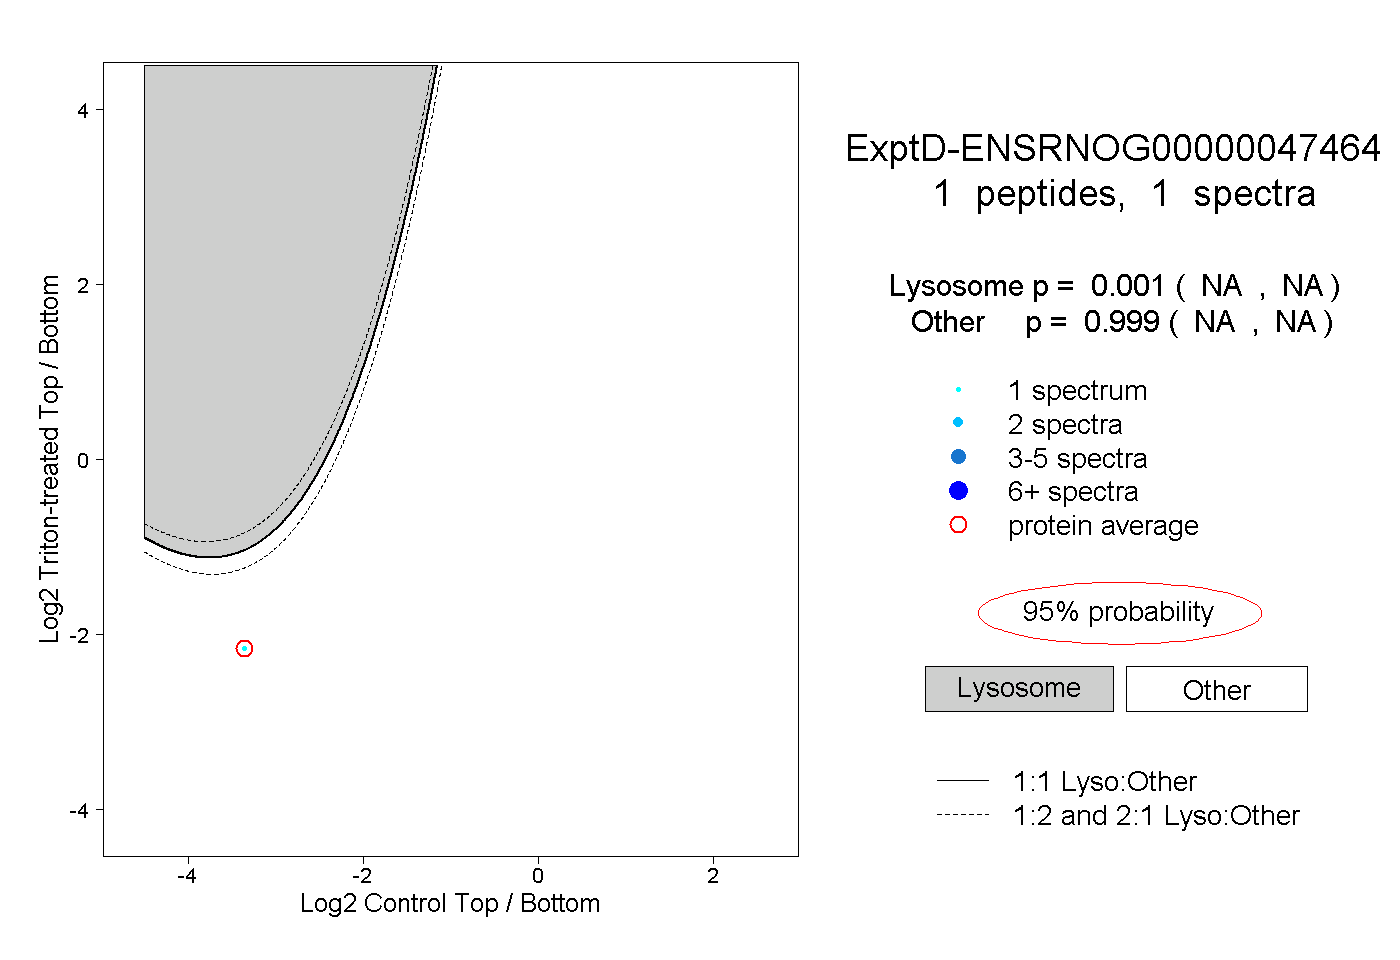
| Plot | Lyso | Other | |||||||||||
| Expt D |
1 peptide |
1 spectrum |
|
0.001 NA | NA |
0.999 NA | NA |